Correction: I found that my tests were invalid in this post because I was using a sub-par BNC cable that was not quite 50 Ohms. Also my scope seems to distort a tiny bit if the signal goes into the top division on the screen. But I'm leaving this here anyway because I think the process was interesting. Actual final test results are down below.
David: That's an interesting option. I did some reading this morning on sampling scopes like you suggested. Seems like a whole other rabbit hole to go down. Thanks for the pointer to the tek scopes forum; I have a 321A that is awaiting repair...
What do you all think of this method of checking scope bandwidth:
https://community.keysight.com/community/keysight-blogs/oscilloscopes/blog/2016/09/01/how-to-measure-your-oscilloscope-and-probe-s-bandwidth-yourselfI ran through it this today on the WavePro 960. Here are my results. Equipment:
HP 213B pulse generator, which is supposed to have a less than 100ps rise time. But it's also like 50 years old, so who knows.
Lecroy WavePro 960, calibrated by LeCroy almost a year ago. I expect it to be working pretty well.
First, the rise time measurement of the HP213B. The "A" trace on this screenshot is the derivative of the actual signal.

Next, I have a wide view to get more FFT points. The red "A" trace is the derivative of the signal. The pink "B" trace is the FFT of the derivative. And the lavender "C" trace is an average of the FFT.
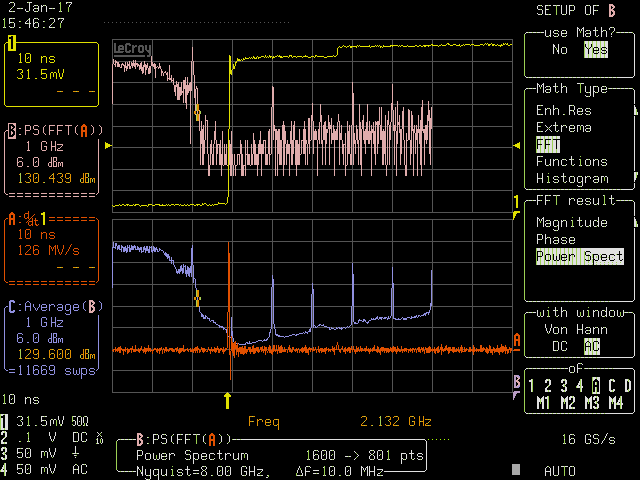
there is a strange spur at 2GHz. The response seems to be down about 6dB leading up to 2 GHz, which should not be correct for this scope. There is also a small step after the initial rise on the signal. I think this is due to a reflection on the 2 meter BNC cable.
Here is another version of the previous image, zoomed in a bit on the horizontal to get rid of the step. The spur a 2GHz disappears. But the response at 2GHz is even lower.

Note that all of the above is plotting the POWER spectrum. If I change the display to MAGNITUDE, all of my FFT values are suddenly in MV/s, which is appropriate given the that the source data is a derivative of voltage, but not particularly helpful in this case. However, the max value at 100MHz is 27.4 MV/s and the min value at about 1.5GHz is 14 MV/s, and that corresponds to a drop of 6dB.
Here is the view with the FFT set to magnitude:

What do you folks think of all this?


