I'll post some screenshots for better clarity at 1M

and 50
output settings...
Screenshots as promised
SDS1102X DSO
SDG1062X (same UI as 2042X and very similar specs.)
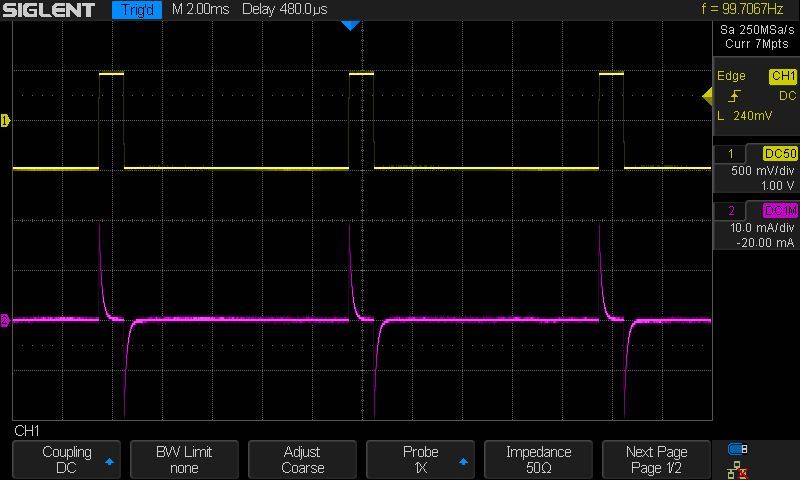
Pulse for better indications of current loadings when properly terminated.
Ch 2: Tek P6021 AC current probe. (values seen may not be correct (attenuation) but waveform is indicative of what's happening)
Shot 1 with only 50
scope internal termination.
Waveform is identical with either 50 or 1M
sig gen source impedance. Only the sig gen displays a difference depending on the source impedance selected.
Next is entirely different, the source is always 50
from the sig gen (explained earlier) but the termination impedance
matters.

Tiny current spikes can be seen on rising and falling edges....clear on the display but not so in the screenshots.


