A little about the Bode Plot (FRA) measurement dynamics of the SDS2000X HD model.
Some manufacturers, for example Keysight and R&S, state the FRA dynamic range from 0dBm down.
It is quite a good way because the dynamic range from the 0dBm level upwards is obvious in other ways.
One essential point is whether the FRA function uses automatic continuous level adjustment during the frequency sweep.
In this case, the entire level range available to the oscilloscope can be used.
The 0dBm level is also practical due to the fact that with the input sensitivity of the oscilloscope set to 100mV/div,
the signal in question is almost the entire vertical range.
In many oscilloscopes, like the Siglent, the vertical display range is 8div.
(of course the full display range would be around 2dBm, 800mVpp)
Siglent's maximum FRA level (multiplier 1x) is of course 80Vpp (10V/div).
This corresponds to a level of 42dBm.
(When I use dBm in this context, unless otherwise noted, the impedance is 50 ohms.)
Of course, the use of such levels requires the use of an external 50 ohm load.
SDS2000X HD's maximum level with its own internal 50 ohm impedance is practically around 22dBm (8Vpp.
In this case max V/div is limited to 1V/div.
Even though max 5Vrms with 50 ohm inputs is mentioned, it is not available for measurements.Everyone can simply calculate / evaluate the part of the dynamic range above the 0dBm level according to the current usage situation.
The end result is that we measure the dynamics from the 0dBm level down.
Siglent Bode Plot (FRA) have two modes: Channel Gain:
Auto and Channel Gain:
Hold. (aka manual)
When
Auto is in use, during sweep FRA continuously (for every single freq step in sweep) adjust input channels sensitivity from 500uV/div up to 10V/div using also fine adjust.
When
Hold is in use, during sweep FRA keep input channels as is when Bode Plot analyzer function is activated. If user want adjust, whole Bode Plot need shut off. (least in this version)
Naturally only Auto mode give full dynamic range (what can be up to over 120 - 140dB (with some notes))
Auto mode is more slow than Channel Gain Hold mode.
In many simple cases Hold mode is well enough for measure something what do not need high dynamic range.
But, in Hold mode, before even start Bode Plot function user need set input V/div so that DUT out signal level do not clip in any point during frequency sweep.
There is also possible to use test signal (DUT In) level profile during sweep but I do not mess and mix it to this simple dynamic test (even when it can use also as tool for some dynamic advantages, but in these cases also measurement methot need be Vin/Vout, instead of Vout).
For look dynamic range I use attenuator method.
It is a simple sure and reliable way to test this. At the same time, you can also see how the phase measurement reacts.
Transit time of the type of attenuator used is (especially at the frequencies used here) very precisely the same regardless of the attenuation level between 0dB and 145dB.
The mechanical step attenuator used, if anyone is interested, is the HP 33321SC/333221SD pair what can step 0 - 145dB with 5dB steps.
Test signal is 0dBm, which goes to the attenuator and from there to input 4 of the oscilloscope.
Ch4 has a high-quality external 50 ohm load due to other experiments I did with slightly higher powers.
Input channels 2 and 3 are not connected to anything.
They reflect the FRA noise floor.
The signal of the reference channel has been attenuated. In this context, it does not affect the test result.
(with higher powers, instead, the crosstalk of the channels must be taken into account in some cases)
Test settings main things.
Signal 0dBm to attenuator what is here as "dummy" DUT.
Center frequency 455kHz (this is because it is one common IF freq and with high quality filters need very high dynamic range if need characterize also stop band.)
Span 10kHz
Input channels 20MHz BW
FRA Amplitude mode in this test is: Vout
Unit: dBm (note there is used external high quality feed thru 50 ohm for DUT out channel (Ch4)
In all test here, FRA sweep start with specified attenuated level then around 454kHz it step to 0dB and then back to attenuation.
First, Channel Gain: AutoCH3 is there only for display FRA base noise level when 500µV/div
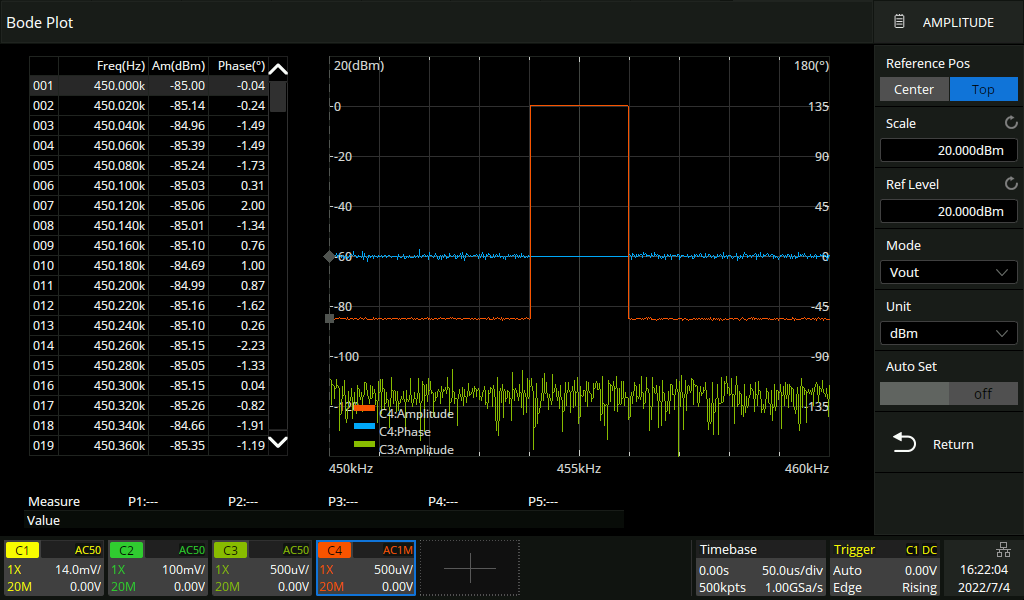 -85dB
-85dB 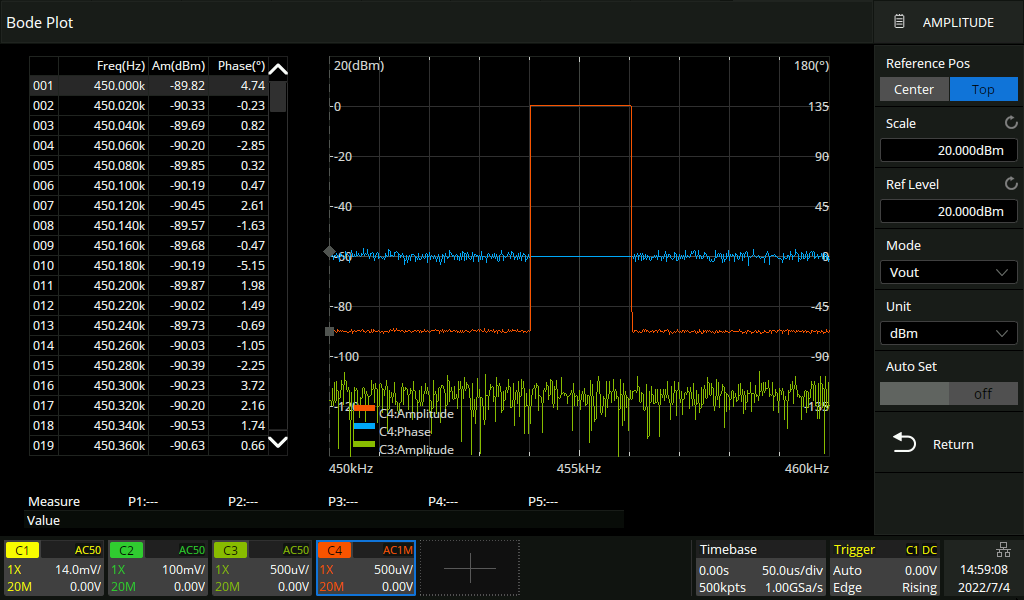 -90dB
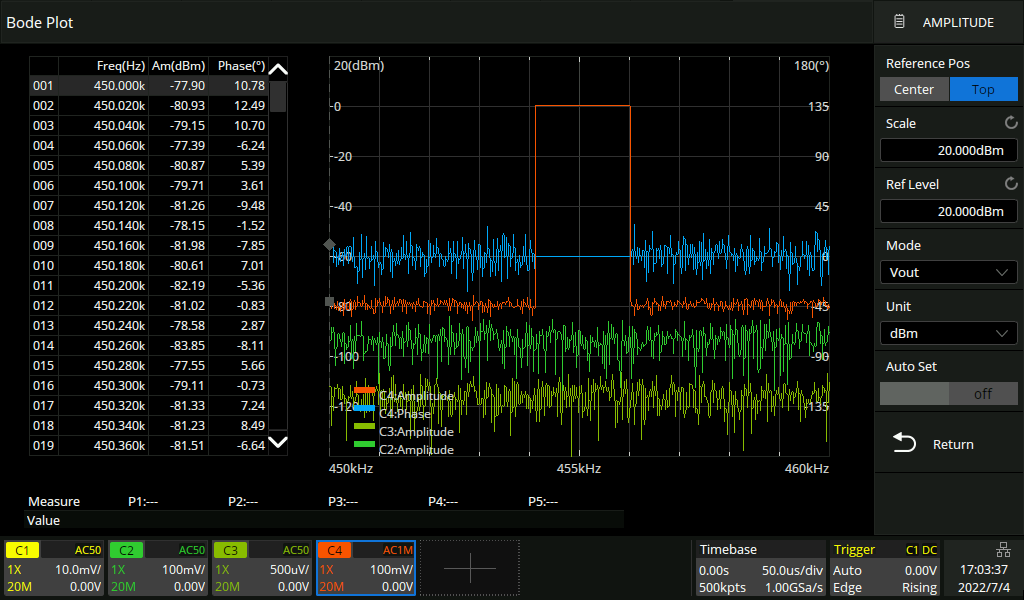
-90dB 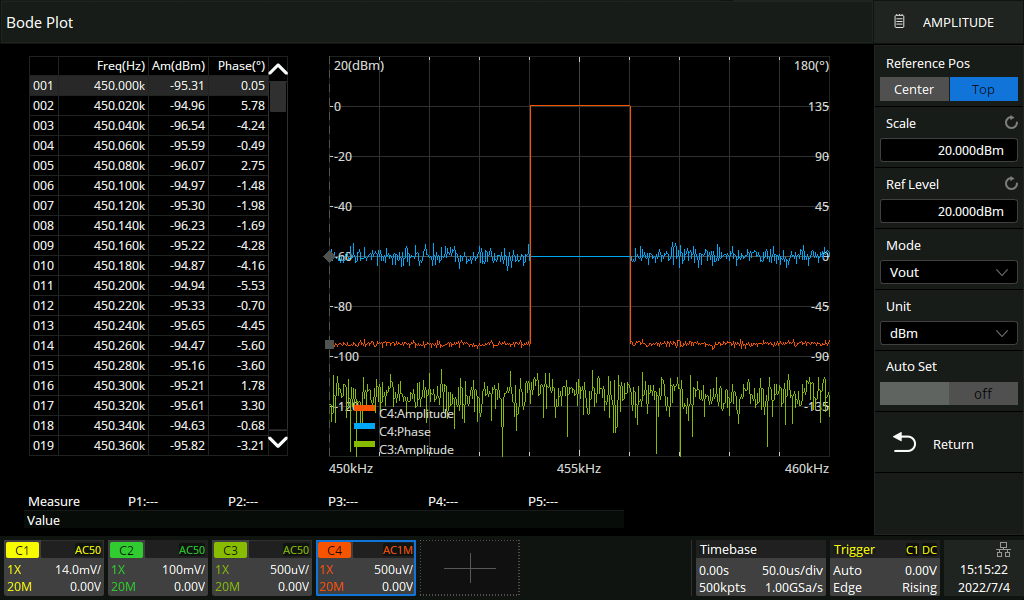 -95dB
-95dB 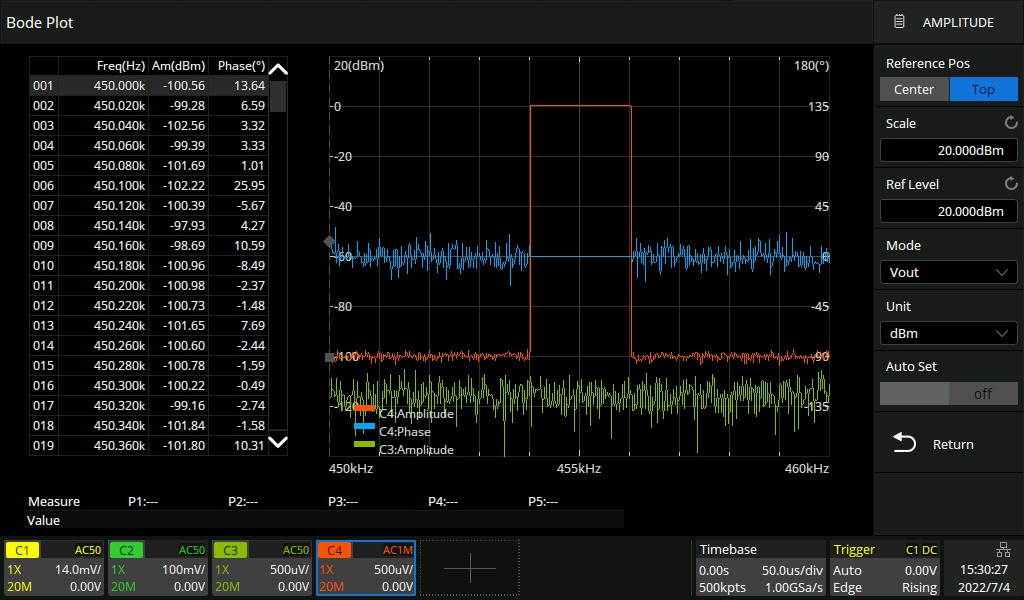 -100dB
How high is -100dBm signal here (sine wave of course).
It is ~6.3 µVpp, 2.24 µVrms, -113dBV Think about it...
Still level well detectable over noise level.
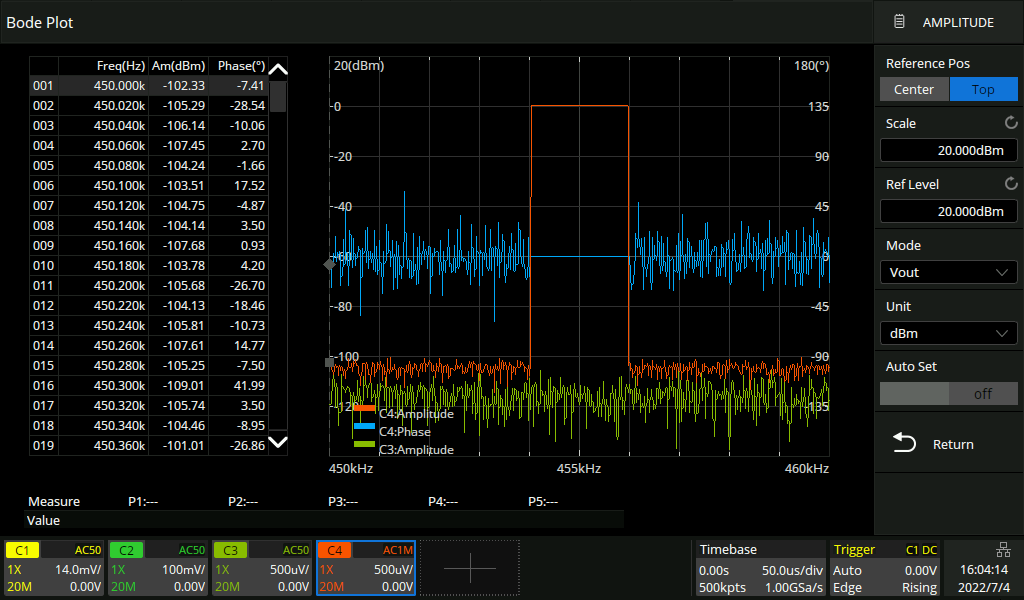 -105dB
Even with this level if you just disconnect test signal you can detect how it drop to full noise floor.
(-105dBm signal (average) level distance to displayed base noise average level is visually estimated still roughly 10dB)
Here -105dBm signal level is 3.6 µVpp and we can see it is still roughly 10dB over base noise average.
If displayed noise average is roughly -115dBm ... keep in mind that 19bit ideal ADC dynamic range is 114dB.
But with Channel Gain Auto our total maximum level correspond 42dBm and this level distance to displayed noise average is roughly 156dB.
Note also test frequency. If we go to audio frequencies, noise level rise, same happen specially when go to higher freq. Example around 60MHz FRA base noise average is roughly -100dBm.
What is FRA base noise level at other frequencies. This together with previous tests with 455kHz can use for roughly estimate available and usable dynamic range for other frequencies.
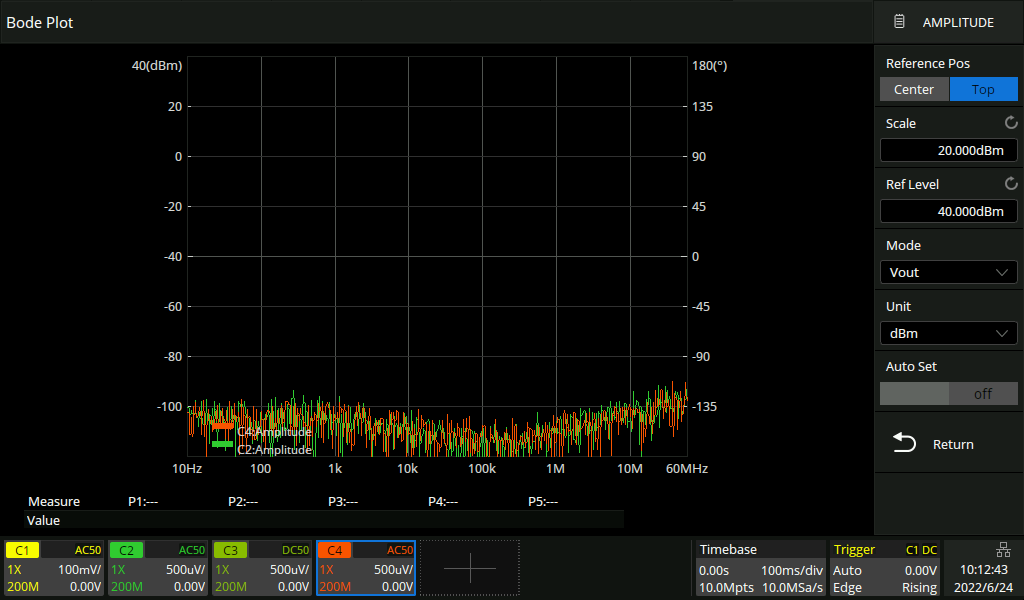
Here tested from 10Hz to 60MHz. Inputs BW 200MHz, inputs open, no signal. (note that with 2000X HD model internal generator max is 25MHz and max level is 13.5dBm)
In image level top is 40dBm so that vertical include FRA whole one sweep dynamic range from noise to max when Channel Gain mode is Auto. (absolute max before signal clipping is bit more than 40dBm and this kind of levels need also external 50 ohm load and of course DUT what have this output level)
Next using Channel Gain: Hold (what ever signal level is when FRA start and during sweep it keep same V/div)
Now CH2 is there only for display FRA noise level when 100mV/div
CH3 is there only for display FRA noise level with 500µV/div (just for compare, not affect anything here)
Test signal level is of course 0dBm to step attenuator.
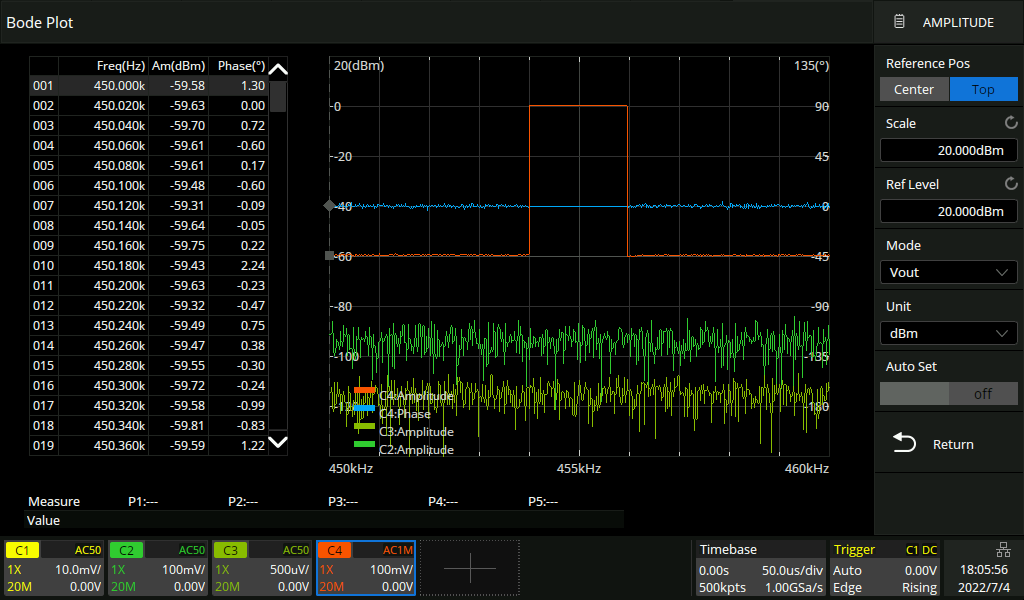 -60dB
-60dBNote: C2 is now displaying relevant base noise level with 100 mV/div input.
 -65dB
-65dB 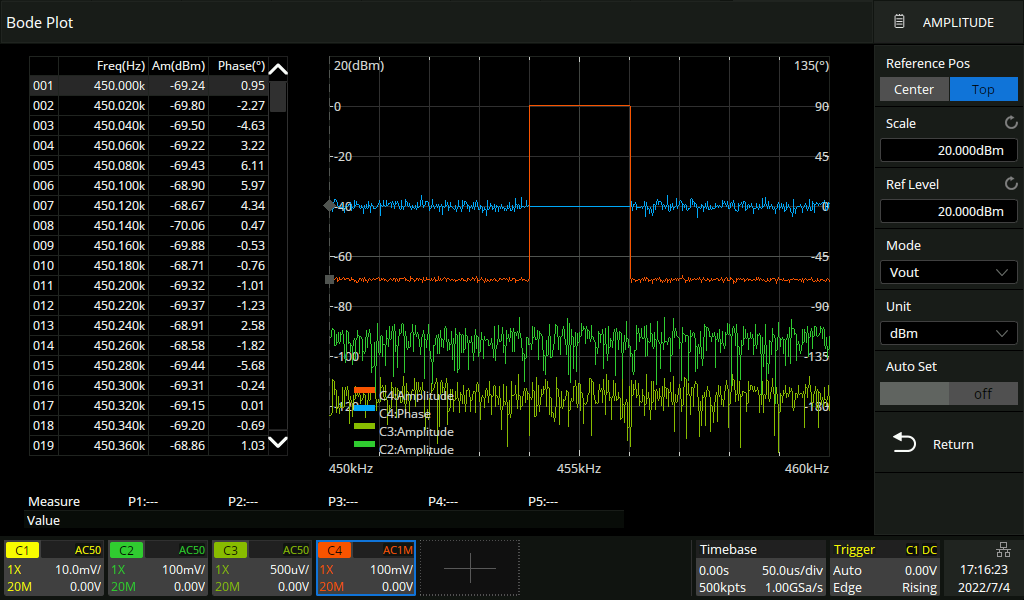 -70dB
-70dB 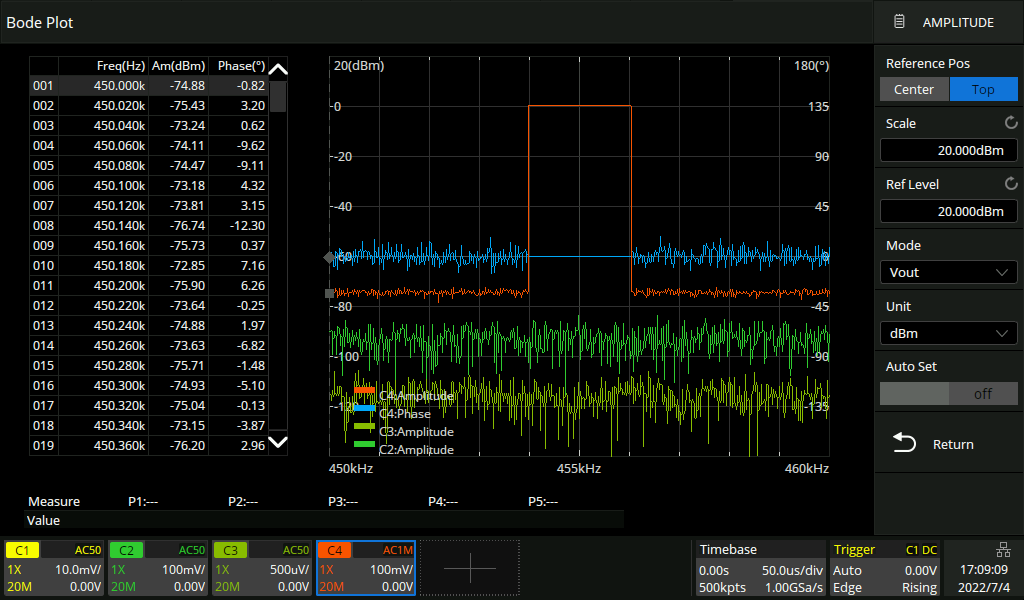 -75dB
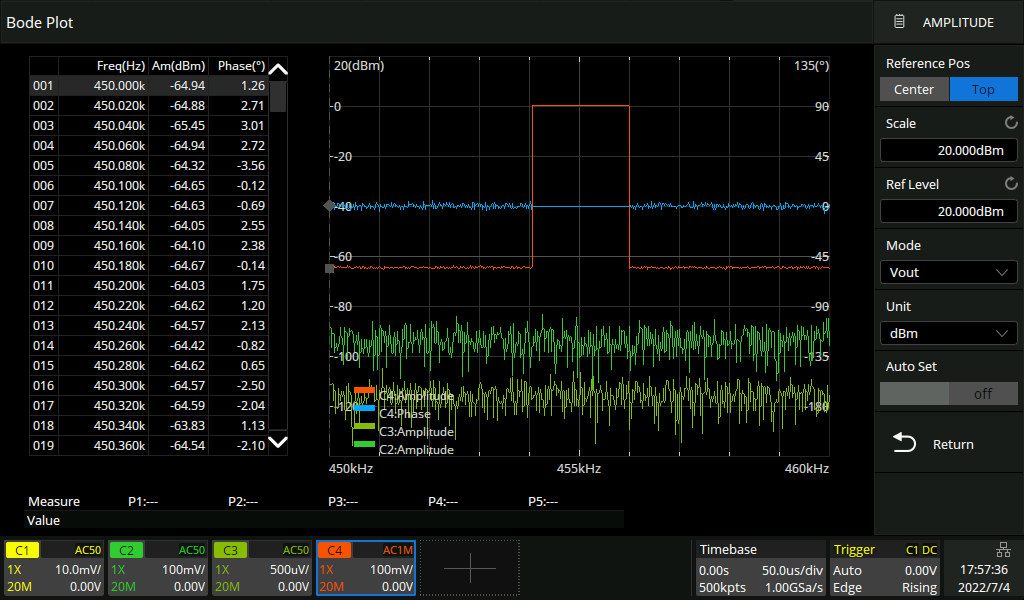
-75dBHow high is -75dBm signal here (sine wave of course).
It is ~112 µVpp, 39.8 µVrms, -88 dBV Think about it, we have 12bit ADC and 100mV/div setting.
(ADC f.s. is here some (small) amount over display vertical range what is 800mV. ADC f.s.)
Let's think with 850mV (not perfect). (850000/4096) ~208µV one ADC step!
Still level is well detectable over noise level. We can still least somehow detect levels even 10dB more down as can see in next images.
 -80dB
-80dB 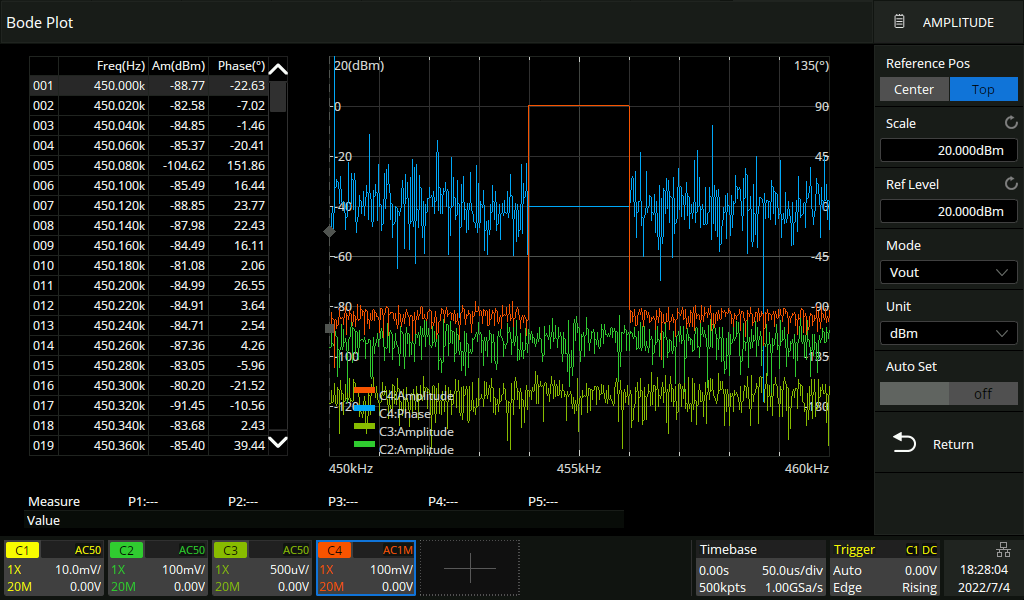 -85dB
-85dBEven with this level if you just disconnect test signal you can detect how it drop to full noise floor.
(-85dBm signal (average) level distance to displayed base noise average level is visually estimated still roughly 10dB)
Here -85dBm signal level is 35.6 µVpp. (with input set 100mV/div it is really small) and we can see it is still roughly 10dB over base noise average.
If displayed noise average is roughly -95dBm and with 100mV/div maximum level is 2dBm...
keep in mind that 16bit ideal ADC dynamic range is 96dB.
As can see Siglent dynamic range is quite good. It have price. Speed.
How this high dynamic range is possible. One important thing is frequency selectivity.
It do not look signal using wide band. Frequency selectivity (RBW) also change depending frequency.
Small extra info: Example freq band 200kHz to 500kHz it use filter what have -3dB width 10kHz and -80dBc ~30kHz
Filter center is tuned during sweep. From 500kHz to 1MHz band filter width is more (but proportionally to freq. same)
There is lot of frequency bands (first is proportionally more wide, 10Hz to 200Hz, then 200 to 500Hz, 500 to 1kHz, 1k to 2k, and so on... and they use different RBW.)
This also reduce signal source spurs and harmonics disturb and also same if DUT generate spurs and harmonics.
Specially when testing frequency changing DUT's, example mixer or more complex circuits (what need 2 channel external SDG when other cannel have same offset whjat DUT produce)What is FRA (Bode Plot) dynamic range depends of course what noise level (level random errors) we can accept. So it is highly subjective.
Of course, if someone defines what are the limit values according to which the dynamic measurement range is declared, and when everyone uses the same criteria, then of course it is different. For example, limits for the noise of the measured value. But even in that matter, a few other factors affecting the matter should also be defined.
Also it (noise level) depends frequency. Best dynamic range (most low noise level) is around between 50kHz to around 1MHz.
When example R&S tell FRA dynamic range is ≥70dB or Keysight tell same, over ≥80dB. Do we know if they are comparable. This plain dB value do not tell much.
It is very different if we tell that something is detectable from base noise or something is enough reliable measurable. What is enough reliable/accurate... it need also define.
Lot of things do not need at all big dynamic range.
So there can use Channel Gain Hold but user need set input channel V/div for maximal DUT out top level without clipping.
Also speed depends how oscilloscope is commincating with generator. Also internal and extrernal generator may have some difference.
Example SDG1000X with USB connection looks like faster than LAN connection and also faster than internal generator even it is also USB bus controlled.
Then with Ghannel Gain Auto, speed also depends signal levels. There is not single truth if someone tell speed. It is valid perhaps only in just same setup and with all same things.
Only single or half truth is, Siglent oscilloscopes FRA speed is slow.
But if some other do not have at all needed dynamics but Siglent have, then this other speed is "infinite" (incapable of the task) and Siglent speed is as it is.
Perhaps, least I hope, we can some day see also "fast mode" in this FRA with all its advantages and especially disadvantages.
Of course some may say there is lot of other kind of instruments specially for do all these FRA things and more, of course there is, and lot of. Also in price only sky is limiting.
I remember my first Rohde&Schwarz SWOB (Polyscop) in decades ago. Expensive analog FRA for up to 1G (so also very different) and still not very stellar, but one good thing, no one did take and borrow it away because it was so heavy (and need also know how to use).
My recommendation is that osscilloscope Bode Plot dynamic range is best to define as dynamic range down from 0dBm level.
Also here if someone want compare different machines.
But then if need print this value to data sheet. There is big problem.
As can see here also in these images one salesman brochure may claim example up to >105dB down from 0dBm and then some other may say that no no it is 80dB.
And both are right.
I have not seen perfect definition for BodePlot dynamic range and what is commond standard or least normal practice and widely in use.
This is just usual oscilloscope and then it have BodePlot. No need numbers for its dynamic range, perhaps Siglent can tell about BodePlot dynamic range simply declaring it -- "adequate".
ETA: for peoples who are not so familiar with dBm here conversion (roughly) to Vpp for these levels used here in previous tests 0 dBm 632.5 mVpp
-60 dBm 632.5 µVpp
-65 dBm 355.7 µVpp
-70 dBm 200.0 µVpp
-75 dBm 112.5 µVpp
-80 dBm 63.2 µVpp
-85 dBm 35.6 µVpp
-90 dBm 20.0 µVpp
-95 dBm 11.2 µVpp
-100 dBm 6.3 µVpp
-105 dBm 3.6 µVppETA 2: Added 10Hz - 60MHz FRA (Bode Plot) base noise level image and some clarifications and typemistakes corr.


