There has been that DHO800 review video by Dave for quite some time now:
Starting at around minute 29:00, Dave compares the DHO814 FFT with that of the venerable Siglent SDS1104X-E. There have been open questions, misleading speculations and unexpected results. End result was that the usual suspects got ammunition to do some unjustified Siglent bashing.
Only now I got around bringing my SDS1104X-E from the other lab and finally try to do some myth busting. For all those, who are interested in real facts and the true contest of how a good 8-bit DSO is handling the test cases presented in the video, here you go…
First was the 10 MHz carrier with 50 kHz 0.02% AM. The result was not very convincing, and it looked basically the same on both instruments.
This test was quite obviously flawed. Whenever designing a test like this, we have to ask ourselves: What do we want to prove – what are the properties of the DUT (Device Under Test) we want to verify – and: what test signals are required to achieve that. After that, we should make sure that we are able to provide the required test signals with the required accuracy – and should have means to verify that.
Let’s start with the test objects, which are the 8-bit SDS1104X-E vs. a 12-bit DHO814. Since I don’t have a DHO800 here, I’ll be using the well known (to me at least) SDS2504X HD instead. This shouldn’t be a problem for demonstrating the difference between 8- and 12-bit acquisition systems.
8 bit (as in the SDS1104X-E) means a total of 256 steps (aka LSB). At a vertical gain of 200 mV/div, the visible screen height covers 1.6 Vpp. This in turn is equivalent to 200 LSB of the 8-bit ADC (the rest is headroom). If we feed a 1 Vpp signal, this corresponds to 125 LSB of the ADC. Thus, we have already lost some 6 dB of the dynamic range by not exploiting the full scale of the ADC – as is the case in most realistic applications.
At 200 mV/div, 1 LSB corresponds to 1.6 V / 200 = 8 mV;
Full scale would then be 256 * 8 mV = 2.048 V.
8 mVpp is just 42 dB below 1 Vpp. As a consequence, we normally cannot expect the FFT to be accurate below -42 dBc in this particular test case.
For the SDS2000X HD the calculation would be quite different. The visible screen height at 200 mv/div covers 1.6 Vpp as well, but this is equivalent to 3840 LSB. 1 LSB is now only 1.6 V / 3840 = 416.7 µV and full scale is only 4096 * 416.7 µV = 1.7067 V.
416.7 µV is 67.6 dB below the 1 Vpp test signal and we should not blindingly trust to get usable results below that.
Now what about the AM signal? It’s not hard to calculate the sidebands. The lowest signal for reliable measurements is achieved by ~1.6% AM depth for the 8-bit case and 0.083% for 12 bits.
You may notice by now that 0.02% AM depth produces -80 dBc sidebands, hence would require at least 14 bits. So the conclusion from this first test can only be:
The amplitude of the sidebands of an AM signal with just 0.02% depth is much too low even for a proper 12-bit acquisition system. Additionally, the reliability and accuracy of such a an impractical low modulation depth from a standard signal source such as an AWG is questionable at best.Yet in practice the FFT can deliver more dynamic range than the bare ADC without math and software. So we can at least try and see how far that goes. But first we need to make sure we get a correct signal, and for this I don’t like to rely on AM with an AM-depth so low that it requires at least 14 bits, but a proper signal mix instead, from well-defined sources with the help of a power combiner and precision attenuators. This way we can get two signals whose amplitudes are 80 dB apart – and even a proper SA isn’t terribly accurate at such ridiculously low levels, as the delta is measured almost 1.5 dB too high.

Ref_-80dBc
Now let’s see what this signal looks like on a true 12 bit DSO with a proper FFT implementation:

SDS2504X HD_FFT_D80dB
Remember? Careful thinking led us to the conclusion that the physical resolution of the 12 bit DSO (the SDS2000X HD particularly) is some 417 µV @ 200 mV/div, hence this would be only 67.6 dB below a 1 Vpp carrier. Nevertheless we were able to measure -80 dBc with still reasonable accuracy. In fact, the error is less than 0.75 dB, hence way more accurate than the SA.
In the video above, this cannot even be called a “test”; nobody cared for the results, tried to measure the level of the sidebands and to judge the accuracy. It was just “oh, there are some spectral lines visible”, which might please some Rigol fanboys, but not an engineer.
Now for the 8-bit SDS1104X-E:

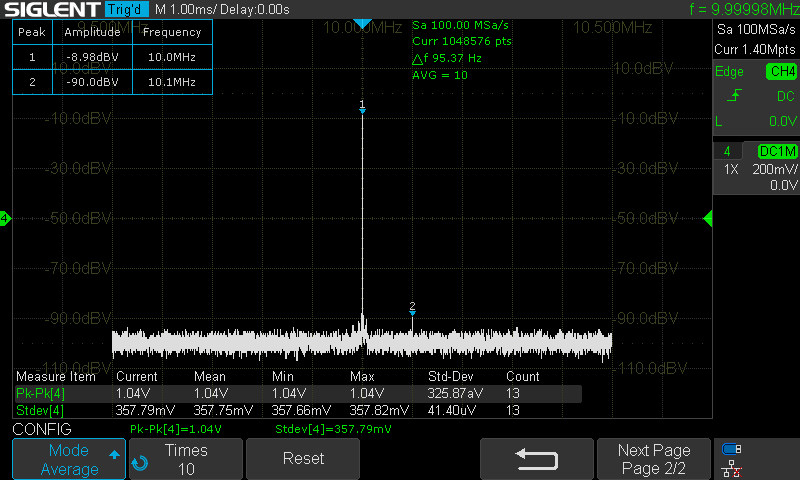
E_FFT_10MHz_D80dB_Avg10
The SDS1104X-E can do the job quite nicely. The error is just about 1 dB, so even the 8-bit DSO can be more accurate than the spectrum analyzer in such borderline situations, where extreme dynamic ranges are required.
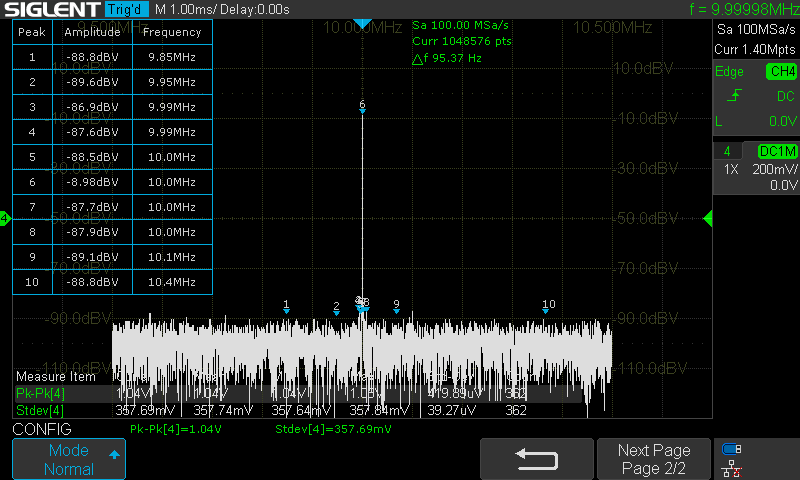
Yes, the Siglent offers the FFT averaging mode, which is about equivalent to the VBW (View Bandwidth) setting on a dedicated spectrum analyzer. This makes for a much clearer view and allows us to see low level signals. Without that goodie, we have to dig in the mess to get the correct measurement every now and then:

SDS1104X-E_FFT_10MHz_D80dB
Peak #9 is the correct one, and I think few people would prefer that mess over a cleanly averaged spectrum view. Yet it apparently must be sexy, as the DHO don’t provide this and nobody complains.
And now for some strange speculations about ERES in FFT math mode. Base line is:
Without appropriate dither, the ADC will just sit at its DC output value as soon as the input signal drops below 1 LSB.If the ADC doesn’t produce any data, then no software trick in the world can make something useful of it. ERES can only enhance the resolution if there is a dither signal. The FFT itself is a resolution enhancement technique, (buzzword “process gain”) and ERES severely limits the bandwidth, so it would be completely useless for general FFT use anyway.
The truth is, that even on a low noise instrument like the SDS1000X-E, input noise is usually high enough to act as a dither. Only the 100 mV/div (hence also 1 V/div and 10 V/div) ranges are so electrically quiet on an SDS1104X-E, that I’ve seen resolution enhancement techniques fail at times.
At this occasion we noticed that the FFT was processed a lot faster in the DHO800. Yes, that’s impressive and of course we would want that for every DSO. But it’s not really a surprise either: a 6 (or even 8?) core processor at 2 GHz should certainly be more powerful than a Xilinx Zync with 2 cores and some 800 MHz. Now if only Rigol made good use of it – the fastest FFT doesn’t help much if the results are as it were shown in the video. By comparison look at the SDS1000X-E screenshots: even without peak table you can clearly see the spectral lines (and not some spurs) and know the amplitude with reasonable accuracy.
Now for the “30 mVpp signal at 10 V/div” test. Yes, this is a clear case where a low-noise 8-bit scope has to give up. In the AM test, the carrier acted as (almost full scale) dither, hence the accuracy of level measurements far below the 8-bit dynamic range was still pretty good. But now we have to rely on the input noise as dither, which will barely exceed 1 LSB at 200 mV/div. Consequently, the accuracy is completely gone, but the signal itself is still clearly visible:

SDS1104X-E_FFT_10MHz_-40dBV_Avg10
Yes, this appears to be the advantage of a 12-bit DSO, but it is nevertheless pretty much meaningless in practice: whenever we have to measure an isolated (single) signal that low, then we just select an appropriate vertical gain. If, on the other hand, this is not possible because there are other stronger signals present at the same time, then we can happily use a less sensitive input range and let those stronger signals act as dither. All in all, the rather high 1 LSB threshold of an 8-bit ADC isn’t really a concern particularly for FFT.
Now finally the great mystery, how Dave managed to get a completely screwed-up picture of the FM modulated signal on the SDS1104X-E. I just could not reproduce it:

SDS1104X-E_FFT_10MHz_FM50k_1kHz
By the way, I‘ve often stated that for emulating an SA, Flattop is the correct window to use. The only alternative in desperate situations would be Blackman, which has a little narrower RBW and still bearable amplitude error. Yet I’ve sticked to Hanning, just to precisely match Dave’s settings. And meaningful results or even accuracy didn’t seem to be a topic in this review anyway…
As always, display averaging gives a clearer picture:

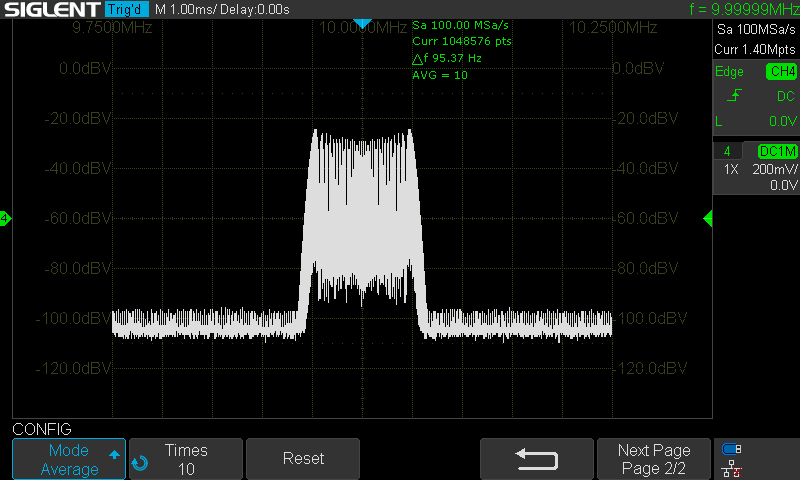
SDS1104X-E_FFT_10MHz_FM50k_1kHz_Avg10
This screenshot shows the expected result and reveals a dynamic range of almost 80 dB. Of course there’s nothing wrong with the Siglent. I’ve known it from the start, because I’ve done extensive tests back in 2017 already, when I wrote my review. The FFT has been improved since then, yet it never failed to display the correct spectrum.
Remember when the DHO800 showed weird things on the screen? Dave tried hard to find the cause – which in the end was just a flaky cable connection. He made even a separate video on it. Yet when the Siglent showed implausible results, Dave just wrote it off as “it doesn’t like it at all” – and Rigol fanboys had a party, even though it should be very clear that such an obvious major bug would not have gone unnoticed for an instrument that’s been on the market for almost 6 years now and numerous examples of its (still) superb FFT have been posted in this forum already.