How can I set a live tend chart in TestController like in EasyDMM 
That's what I showed above was a live trend chart in both screenshots. It is a little clunky to setup though, as I mentioned. Or I should say it's clunky to learn it at first.
To have the charts and tables load data, you need to enable the Log on the main window. Click log and pick the time interval.
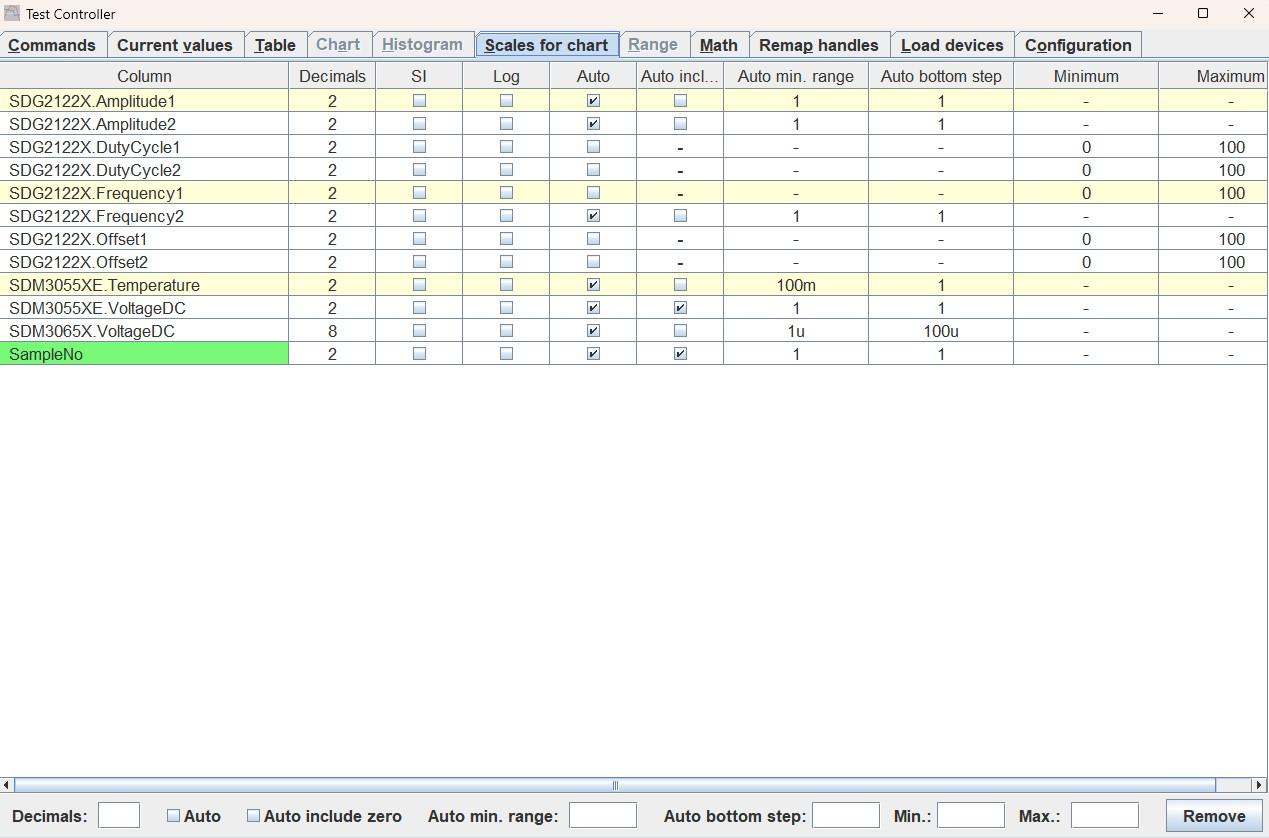
Then go to the "Scales for chart" tab and set your scale range for each device that will be tracked. In my screenshot I set Auto min range to 1uV and Auto bottom step to 100uV. Experiment with those settings to get the hang of it. If you search the TC thread for "scales for chart" you'll probably find other useful info.
This is what mine looks like right now:

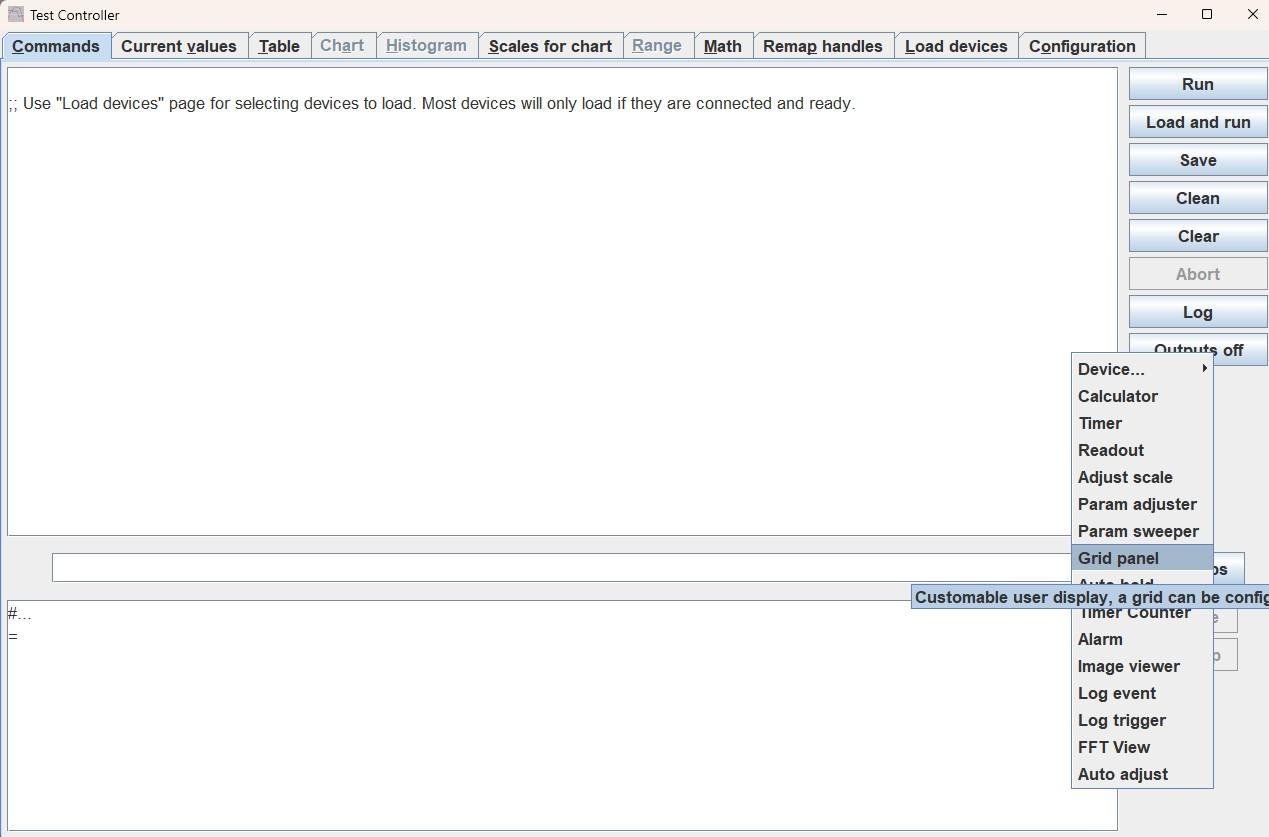
For the other popups you see in my screenshot, go back to the main (Commands) tab, click Popups and choose what you want. Readouts, Grid Panels, Device Mode panels, and Adjust scale are what I showed in my previous screenshot.
Popups:

You can pop the grid panels out as individuals by right-clicking them. You can also right-click lots of things to change colors.
There's lots of fancy things you can do with scripting, but I'm not likely to bother with any of that. The basic stuff does what I need. It's pretty awesome for these meters.