Author Topic: Siglent SDS800X HD Review & Demonstration Thread  (Read 212960 times)

0 Members and 2 Guests are viewing this topic.

Offline BRZ.tech

  • Regular Contributor
  • *
  • Posts: 51
  • Country: br
Re: Siglent SDS800X HD Review & Demonstration Thread
« Reply #175 on: March 10, 2024, 01:15:00 pm »
Dear @Performa01
Regarding this topic, I consider it like Star Trek episodes, in terms of content and depth. I can't imagine the next episode...
The SDS800X HD really put SIGLENT at the forefront and in the minds of hobbyists compared to other manufacturers. Soon we will have 1,000,000 views on the set of related topics.
Competing manufacturers will have to greatly improve their hardware and free firmware to compete with the SDS800X HD in entry-level DSO/MSO. For beginners and hobbyists, it can deliver much more quantity and quality of information, for an affordable price, compared to competitor models, in addition to 12 bits of vertical resolution.

As for the 8-digit frequency meter, it is spectacular, achieving displays with single-digit resolution, frequencies up to 99.999999 MHz. Competitive models provide a maximum of 6 digits, with single-digit resolution of 999.999 KHz.

I am currently a user of a RIGOL MSO5000, which serves my hobby. But I intend to soon buy one the SDS800X HD, perhaps the SDS804X HD, even for the challenge of reproducing your tests, and learning many things. Very soon, with regular deliveries from SIGLENT, as here for me the best value for money is to buy on Aliexpress.

As for my doubts and questions, let me know @Performa01 if you have a YouTube channel that shows step by step how to carry out these brilliant tests. And if you accept it here on the list, let “beginners” ask you “obvious things” questions.


In the HAM – Amateur Radio universe, in which I am, which is a potential client for the SDS800X HD, we measure many very low amplitude signals, below 1mVrms, in the time domain, and in the FFT, it can be in dBm or dBV . It looks like the SDS800X HD can present both possibilities.

Any colleague on the topic can also answer my questions, they will be welcome.

Maybe it's already on your rehearsal schedule:
I suggest you do a test to measure a signal, which we use in HAM, a VHF sinusoidal signal f=146MHz, without modulation, Amplitude = 1mVrms, at 50 Ohm, to start, and Decreasing the Amplitude up to 10uVrms, and if possible even lower, up to the sensitivity limit of the SDS800X HD. And present the images in the Time domain, and also in the Frequency domain, using the FFT with the Table, it can be in dBm or dBV.
And present your conclusions to the HAM universe.

Afterwards, perform FM Modulation, with a sinusoidal signal of f=1KHz, with a 5KHz deviation. Present the same images, in the Time and FFT domains.
And present your conclusions to the HAM universe.

Afterwards, perform AM Modulation, with a sinusoidal signal of f=1KHz, with Modulation Index = 80%. Present the same images, in the Time and FFT domains.
And present your conclusions to the HAM universe.

Translation with Google translator.
TKS.
73.
« Last Edit: March 10, 2024, 06:16:36 pm by BRZ.tech »
 
The following users thanked this post: Performa01, RAPo

Offline rf-loop

  • Super Contributor
  • ***
  • Posts: 4130
  • Country: fi
  • Born in Finland with DLL21 in hand
Re: Siglent SDS800X HD Review & Demonstration Thread
« Reply #176 on: March 10, 2024, 05:21:03 pm »
You ask from @Performa01
But here is some quick demo from me.

carrier bit over 145MHz, AM 1kHz 80% ( sidebands are ~-8dBc )
Yes when I did it I forget you ask 146... my head "best berore" day was far away in previous millenium...

For 2m band there need use 500MSa/s so even with 2M FFT we can not get more resolution - this is simple direct FFT.
( and I have not tested if internal down conversion (Nyquist "trick") can use so that result give any even somehow acceptable result)

(note, I have used Hamming window so levels accuracy is poor. (FlatTop is better but around 890Hz RBW with this setup is so borderline for detect sidebands so I use here Hamming...  when carrier and sidebands freq do not match with FFT bins there is some amounf scallop error in amplitude. With -107dBm it can clearly see also that noise start affect lot (it can see when look carrier and sidebands persistence traces... I have usede 30 sec persistence)
There is Tektronix 50ohm feedthru termination in scope input.
image a: -87dBm carrier is ~10uVrms
image b: -107dBm carrier is ~1uVrms


Signal come from HP 8642B "boat anchor"

Very limited time so only these examples.


« Last Edit: March 11, 2024, 04:33:33 am by rf-loop »
BEV of course. Cars with smoke exhaust pipes - go to museum. In Finland quite all electric power is made using nuclear, wind, solar and water.

Wises must compel the mad barbarians to stop their crimes against humanity. Where have the (strong)wises gone?
 
The following users thanked this post: Performa01, egonotto, orzel, trackersoft, BRZ.tech

Offline BRZ.tech

  • Regular Contributor
  • *
  • Posts: 51
  • Country: br
Re: Siglent SDS800X HD Review & Demonstration Thread
« Reply #177 on: March 10, 2024, 06:53:00 pm »
You ask from @Performa01
But here is some quick demo from me.

carrier bit over 145MHz, AM 1kHz 80% ( sidebands are ~-8dBc )
Yes when I did it I forget you ask 146... my head "best berore" day was far away in previous millenium...

Dear @rf-loop,
I am very grateful for providing your input.

I modified my previous post to add:
"Any colleague on the topic can also answer my questions, they will be welcome."

As for the wavelength frequency in 2m, f=145MHz, there is no problem. I indicated f=146MHz because it is the center of the 2m band here in my country. But calculating at 145MHz will not change the practical effect of the test. TKS.

In image "a", at the Carrier frequency, with 10uVrms of input Amplitude, in the AM signal, it was great to see the exact Amplitudes and Frequencies, and clearly, of the Carrier and LSB and USB lanes.

In image "b", it was even better to see the same information, and well defined, with an AM signal input amplitude of 1uVrms...

In my opinion, the SDS824X HD passed the AM test...

As for the CW and FM Modulation test, it is not possible to know yet.

@rf-loop, a question, because I don't know how to use SIGLENT's UI: in your table you present "MARKER: 1, 2 and 4", but you did not present "Marker: 3". Can you explain why?

TKS
73.

« Last Edit: March 10, 2024, 06:58:20 pm by BRZ.tech »
 

Online Martin72

  • Super Contributor
  • ***
  • Posts: 6265
  • Country: de
  • Testfield Technician
Re: Siglent SDS800X HD Review & Demonstration Thread
« Reply #178 on: March 10, 2024, 07:07:06 pm »
Hi,

Quote
in your table you present "MARKER: 1, 2 and 4", but you did not present "Marker: 3". Can you explain why?

You can set and activate/deactivate the markers individually.
Example:
In my bandwidth measurement yesterday, I first measured the 70Mhz variant and distributed markers 1-5 accordingly.
With the 200Mhz variant, for example, markers 2 (which I had set to 25Mhz) and 3 (set to 50Mhz) no longer made sense, so I no longer activated them.

"Comparison is the end of happiness and the beginning of dissatisfaction."
(Kierkegaard)
Siglent SDS800X HD Deep Review
 
The following users thanked this post: BRZ.tech

Offline BRZ.tech

  • Regular Contributor
  • *
  • Posts: 51
  • Country: br
Re: Siglent SDS800X HD Review & Demonstration Thread
« Reply #179 on: March 10, 2024, 07:17:19 pm »
Hi,
Martin72.
Thank you for your response.
Understood, regarding disabling the marker individually. This is very practical when you have many weak signals around a signal of measurement interest.
I will see your Bandwidth measurement in the other topic.
I inform you that I always watch the videos on your YouTube channel...

TKS
73.
 
The following users thanked this post: Martin72

Online Performa01Topic starter

  • Super Contributor
  • ***
  • Posts: 1686
  • Country: at
Re: Siglent SDS800X HD Review & Demonstration Thread
« Reply #180 on: March 11, 2024, 08:37:24 am »
Ham Test

Here come some tests that could be of interest for HAM operators.

First, I should ensure that expectations don’t get unrealistic. A general-purpose oscilloscope like the SDS800X HD is neither a spectrum analyzer nor a test receiver, even when its noise figure drops below 10 dB at frequencies above 300 kHz. Yet it just works on the full input signal bandwidth, there is no pre-selector, no mixer to shift small portions of the upper spectrum down to a lower intermediate frequency and no filter that could isolate the IF signal.

In the time domain, 400 µVrms is pretty much the limit for reliable triggering, indicated by a correct trigger frequency counter display; for even lower levels, triggering gets increasingly sporadic and at 100 µVrms, the trigger frequency counter drops below 1 MHz. Only if we have a strong copy of the signal of interest, such as measuring the stop band of a filter, we could trigger on the input signal and use the Average math function to make even very weak output signals visible and measurable, even those way below the noisefloor, as has been demonstrated already in this thread.

For all the following tests, a Siglent SDG7102A AWG with OCXO option has been directly connected with coaxial Hyperflex 5 cables, a step-attenuator Wavetek 5080.1 and an inline terminator “hp10100C” at the scope input.


CW Test

For the 1 mVrms demo I had to bring quite a lot of information onto a single screen:


SDS824X HD_SA_CW_146MHz_1mV

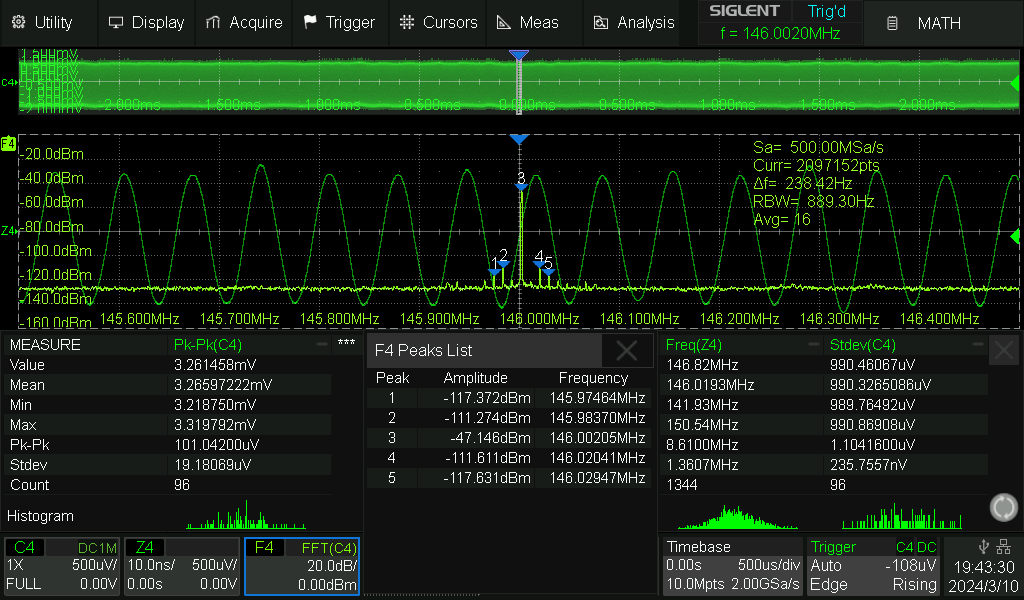
The main window at the top is showing the 146 MHz signal at a timebase of 500 µs/div. We need that slower timebase to get sufficient data for a 2 Mpts FFT. Of course we can’t see any details there, hence there is the zoom window below, where the signal is displayed at a timebase of 10 ns/div. We can see that the vertical position is not constant across the screen width, which hints on the noise that gets very noticeable at such low signal levels.

The zoom window also contains the FFT which reveals some weak modulation due to noise and we can see the corresponding sidebands indicated by markers 1, 2, 4 and 5, whereas marker 3 corresponds to the main signal.

Below we have two windows nested: the advanced measurements together with the Peaks List, for which I’ve freed up some space by removing measurements 2 and 3. We can see that the amplitude measurements in the time domain still work reasonably well, at least Stdev (= AC-RMS), whereas the peak-to-peak amplitude cannot be accurate – once again because of the noise.

The signal frequency measurement is not accurate as well and all automatic measurements have a high variance, as can be seen in the measurement statistics and histograms, yet the 7-digit trigger frequency counter is still rock stable and pretty accurate. Of course, it is 2 kHz off, which is equivalent to 13.7 ppm, but that’s because the time base of the SDS800X HD has 25 ppm tolerance, which is pretty much standard, while Siglent’s higher end DSOs starting at the SDS2000X plus provide class leading 1 ppm timebase accuracy.

The peak table shows the various signal amplitudes, but we are mainly interested in Peak #3, which is indicated as -47.146 dBm at 146.00205 MHz. Surprisingly, the frequency is exactly the same as the trigger frequency counter, hence absolutely correct relative to the SDS800X HD timebase, also the amplitude is pretty much spot on (should ideally be -47.0 dBm).

At this point I should mention that the Peak table is automatic and we only set the search parameters, i.e. threshold and excursion. This is in contrast to the Markers, which can be preset on peaks or harmonics, yet each marker can be set individually to any desired frequency by the user. For the measurements here, Peak tables have been used exclusively.

There is no point to further look at the time domain for weaker signals, because they will get heavily distorted and eventually buried in the noise anyway. Yet I don’t change the arrangement and only move the zoom trace out of view.

Next, we try 100 µVrms:


SDS824X HD_SA_CW_146MHz_100uV

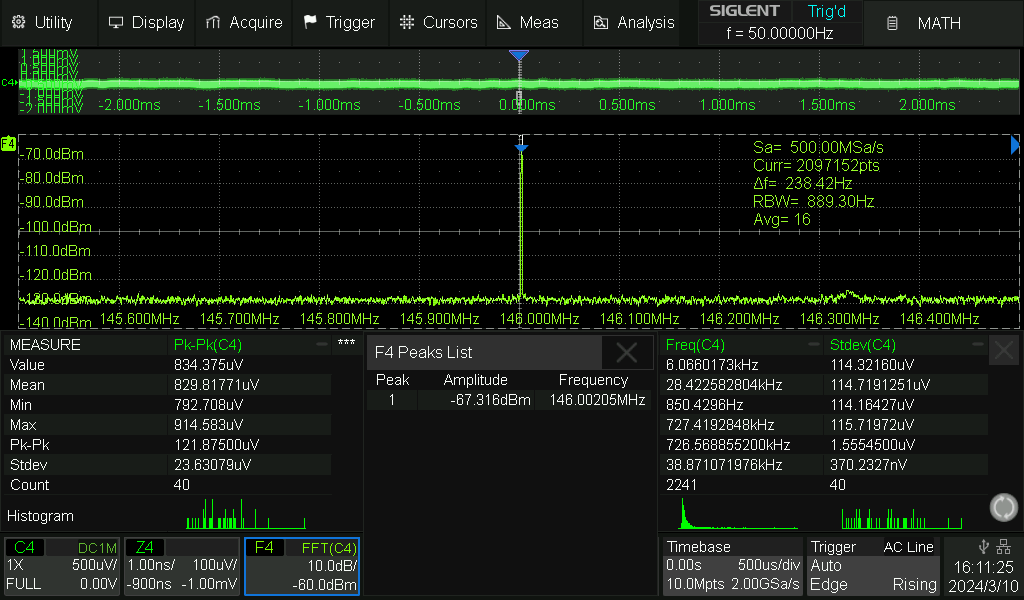
The main window at the top shows mainly noise for the 100 µVrms signal at 245 MHz bandwidth. The zoom window with the FFT displays a clean spectral line, hence we only get a single peak marker.

The advanced measurements below just try to measure the noise, even though the Stdev measurement still isn’t too far off – just a coincidence?

Since such a weak signal cannot be properly triggered anymore anyway, I’ve used AC-line trigger instead and the trigger frequency counter just shows a constant 50 Hz now. FFT doesn’t need a triggered signal.

The peak table shows the signal amplitude as -67.316 dBm at 146.00205 MHz. The amplitude is still pretty accurate (should ideally be -67.0 dBm).

Now let’s try 10 µVrms:


SDS824X HD_SA_CW_146MHz_10uV

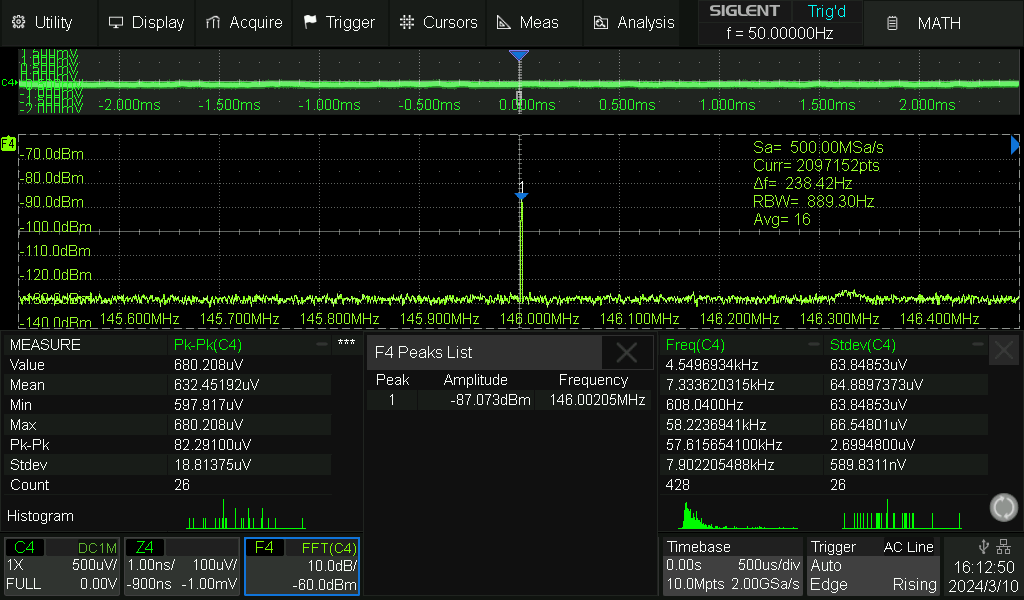
Once again, we get a clean spectral line with a single peak marker.

The advanced measurements below are totally meaningless, but the peak table shows the signal amplitude extremely accurate as -87.073 dBm at 146.00205 MHz.

Another attempt with 1 µVrms:


SDS824X HD_SA_CW_146MHz_1uV

One more time, we get a clean spectral line with a single peak marker.

The advanced measurements below are totally meaningless, but the peak table shows the signal amplitude pretty accurately as -107.291 dBm at 146.00205 MHz.

A final attempt with 100 nVrms:


SDS824X HD_SA_CW_146MHz_100nV

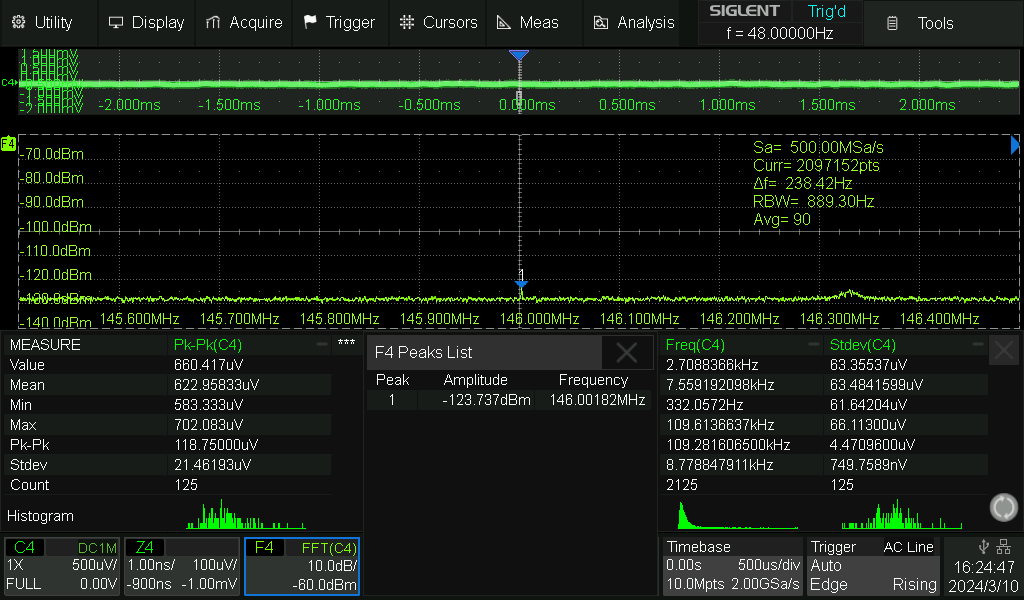
We even get a tiny spectral line, but have to tweak the search parameters to get the peak marker. Its amplitude is now way off: -123.737 dBm at 146.00182 MHz (should be -127.0 dBm). The signal is just too close to the noise floor now.

This test is quite revealing. Even a 100 nVrms signal could be detected, and even though the signal amplitude was off by 3.26 dB, the frequency could still be measured with just ~200 Hz error (relative to the DSO’s timebase that is)!


FM Test

For the modulation tests, I did not feel like trying many different levels again, so 1 mV and 10 µV RMS shall be sufficient for FM.

First I need to repeat what I’ve already stated initially: An oscilloscope is a baseband instrument, not a spectrum analyzer. There is only so much frequency resolution we can get from a 2 Mpts FFT. As a consequence, the expectations shouldn’t be very high when looking at one kilohertz frequency spacing in signals from the 2 meter band.

Modulation: 1 kHz modulation frequency and 5 kHz frequency deviation.

1 mVrms at 146 MHz first:


SDS824X HD_SA_FM_146MHz_1mV

Well, that’s not very convincing. I was forced to use the Blackman window, which is still usable for spectrum analysis with a max. amplitude error of 1 dB. Its resolution bandwidth is not that much better than Flattop hence the picture isn’t very useful and we only get a vague idea of the FM spectrum.

It should be clear that a general-purpose oscilloscope isn’t a test receiver. If we look at bandwidth limited signals, like filtered IF, where we need not worry about aliasing from unrelated signals in the neighborhood, we could just use the “frequency conversion by undersampling” method.

Any ADC acts as a mixer, thus producing a spectrum of ±n * fi ± m * fs, where fi is the input frequency and fs is the sample clock, while n and m are just integers running from 0 to (theoretically) infinity. During normal operation, we don’t want to see any mixer products, which is perfectly possible as long as the input signal and all its harmonics don’t exceed fs/2 and the output of the ADC has a brick-wall filter (then in the digital domain of course, aka Sinc filter or sin(x)/x reconstruction) that removes everything above fs/2.

Yet in some circumstances, we can make use of a certain high-order mixer product, just as in this example, where the effective FFT sample rate is only 5 MSa/s, which is quite obviously way too low for a 146 MHz input signal.

According to the formula given above, we are aiming at the mixer product for 1 * fi - 29 * fs, which is

1 * 146 MHz – 29 x 5 MHz = 146 MHz – 145 MHz = 1 MHz;

Now if we set the center frequency to 1 MHz, we get the carrier at 146 MHz and a resolution bandwidth of only 35.57 Hz, even with just 512 kpts FFT, hence can also clearly see the sidebands and their 1 kHz spacing. 16x averaging has been used in order to get a clean and stable display:


SDS824X HD_SA_FM_146MHz_1mV_5MSa

Be aware that the true center frequency is Peak #6 at 1.00197 MHz because of the SDS824X HD timebase tolerance of 25 ppm.

The following table compares the measured sidebands with the expected ones in dBm:

Ord.   Meas.   Expected
  0   -62.052   -62.083
  1   -56.750   -56.763
  2   -73.700   -73.713
  3   -55.823   -55.833
  4   -55.200   -55.223


Now for the 10 µVrms test:


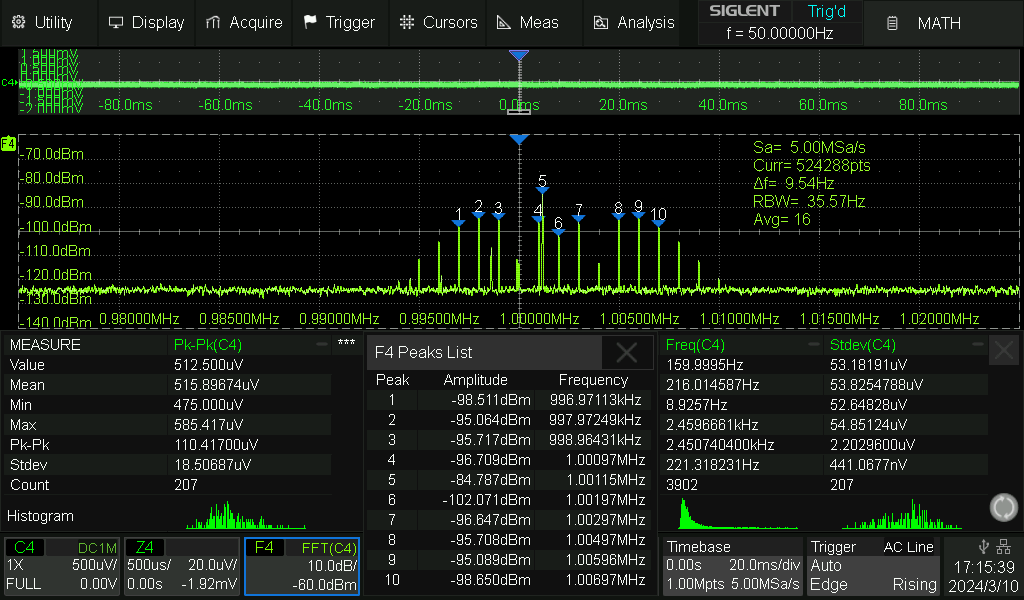
SDS824X HD_SA_FM_146MHz_10uV_5MSa

There is a spurious signal at marker 5 exceeding the signal spectrum – we just have to ignore it.

The following table compares the measured sidebands with the expected ones in dBm:

Ord.   Meas.   Expected
  0   -102.07   -102.083
  1   -96.700   -96.763
  2   -113.70   -113.713
  3   -95.700   -95.833
  4   -95.100   -95.223
  5   -98.500   -98.733


All in all the down-mixing via the ADC can save our day as long as we have an isolated signal and the signal levels don’t get too low.

There are several caveats though:

•   We need to make sure that n is always positive, otherwise we’d get the result in reverse frequency position, i.e. the upper sideband appears below the carrier and vice versa.
•   Mixing with the 29th harmonic of the sample clock introduces also 29 times more phase noise and jitter and this might get visible the FFT plot.
•   Amplitude accuracy might suffer, as a harmonic mixing process is not guaranteed to be as efficient as the fundamental one, hence we might see some attenuation.


AM Test

Modulation: 1 kHz modulation frequency and 80% modulation depth.


SDS824X HD_SA_AM_146MHz_1mV

Well, that looks familiar. Once again, the picture isn’t great and we only get a vague idea of the AM spectrum. The sidebands should be -8 dBc = -61.6 dBm. The deviations come from the insufficient resolution bandwidth and the amplitude error of the Blackman window.

We are looking at the mixer product for 1 * fi - 29 * fs again, which is

1 * 146 MHz – 29 x 5 MHz = 146 MHz – 145 MHz = 1 MHz;

Now if we set the center frequency to 1 MHz, we get the carrier at 146 MHz and a resolution bandwidth of only 35.57 Hz, hence can also clearly see the sidebands and their 1 kHz spacing. 16x averaging has been used in order to get a clean and stable display:


SDS824X HD_SA_FM_146MHz_1mV_5MSa

Be aware that the true center frequency is Peak #3 at 1.00197 MHz because of the SDS824X HD timebase tolerance.

The sidebands should be -8 dBc = -55 dBm. The accuracy is very high despite the harmonic mixing process.


General Remark: I don’t maintain a YouTube channel and my time is limited. Since I’ve already published most of the intended content, and I made sure the relevant information can easily be found by means of the table of contents in the opening posting, I don’t mind people asking questions here, even newbie questions 😉


EDIT: Corrected the statement for the 10 µV FM-test and added a comparison of measured vs. expected results.
« Last Edit: March 11, 2024, 11:16:10 am by Performa01 »
 

Online Martin72

  • Super Contributor
  • ***
  • Posts: 6265
  • Country: de
  • Testfield Technician
Re: Siglent SDS800X HD Review & Demonstration Thread
« Reply #181 on: March 11, 2024, 08:47:57 am »
So much useful and worth knowing information and basics in a single thread - that's why I will keep the link to it "forever" in my signature.
"Comparison is the end of happiness and the beginning of dissatisfaction."
(Kierkegaard)
Siglent SDS800X HD Deep Review
 
The following users thanked this post: Performa01, egonotto, matus, Mortymore, Grandchuck, KungFuJosh, BRZ.tech

Offline hpw

  • Frequent Contributor
  • **
  • Posts: 382
  • Country: 00
Re: Siglent SDS800X HD Review & Demonstration Thread
« Reply #182 on: March 11, 2024, 08:58:54 am »

@CW Test: could be enhanced as 1/f PN and Jitter test. Using a -3dB signal at fs/xxx, where xxx is exact 2^n and then ZOOM-In or use simple a 10MHz OXCO sine signal.

This is mostly done on Audio as using fs/4 as looking for 1/f & symmetric jitter or modulation spurs.

I did similar tests already on a Siglent SSA and the internal reference synthesizer is as  :palm:
 

Offline Muttley Snickers

  • Supporter
  • ****
  • Posts: 2368
  • Country: au
  • Cursed: 679 times
Re: Siglent SDS800X HD Review & Demonstration Thread
« Reply #183 on: March 11, 2024, 09:58:47 am »
(snip...) 
General Remark: I don’t maintain a YouTube channel and my time is limited. Since I’ve already published most of the intended content, and I made sure the relevant information can easily be found by means of the table of contents in the opening posting, I don’t mind people asking questions here, even newbie questions 😉

You sir are to be thoroughly commended, an inspirational piece of work if ever there was.   :clap:

So much useful and worth knowing information and basics in a single thread - that's why I will keep the link to it "forever" in my signature.

Just to add to Martin72's post.
As the thread is currently 8 pages and still under 20 people have the ability to select "All" at the top of the page to open all of the existing pages and then print as a hard copy or save as a pdf for reference, don't forget the images though. You won't find this level of information in any user manual that's for damn sure.
 
The following users thanked this post: Performa01, Martin72, BRZ.tech

Offline Mortymore

  • Frequent Contributor
  • **
  • Posts: 467
  • Country: pt
Re: Siglent SDS800X HD Review & Demonstration Thread
« Reply #184 on: March 11, 2024, 10:18:20 am »
So much useful and worth knowing information and basics in a single thread - that's why I will keep the link to it "forever" in my signature.

Great idea! I've added a signature with the link to this thread also.

..
Just to add to Martin72's post.
As the thread is currently 8 pages and still under 20 people have the ability to select "All" at the top of the page to open all of the existing pages and then print as a hard copy or save as a pdf for reference, don't forget the images though. You won't find this level of information in any user manual that's for damn sure.

I've been compiling in a doc the posts from Performa1, according to the list of links provided in the 1st.
It's not in a PDF format because I suspect that Performa1's work is not done yet  ;) since he keeps open to suggestions and extremely supportive answering them.  :clap:

PS: By the way... This weekend I made the same "mistake" as Martin72 and bought an SDS804X-HD. It was shipped 10 minutes ago, wile I was reading this thread updates  8)
« Last Edit: March 11, 2024, 10:25:58 am by Mortymore »
 
The following users thanked this post: Performa01, 2N3055, Martin72, core, BRZ.tech

Offline pdenisowski

  • Frequent Contributor
  • **
  • Posts: 779
  • Country: us
  • Product Management Engineer, Rohde & Schwarz
    • Test and Measurement Fundamentals Playlist on the R&S YouTube channel
Re: Siglent SDS800X HD Review & Demonstration Thread
« Reply #185 on: March 11, 2024, 10:24:36 am »
I was forced to use the Blackman window, which is still usable for spectrum analysis with a max. amplitude error of 1 dB. Its resolution bandwidth is not that much better than Flattop hence the picture isn’t very useful and we only get a vague idea of the FM spectrum.

Again, many thanks for the detailed analysis - if you don't already work for a T&M manufacturer, you really ought to consider it :)

Quick question: which window types does the Siglent support?   

I'm not sure I would have used a Blackman(-Harris) window here, although I presume this is the default (at least it's the default on a lot of scopes).  Since you're going to have to trade between frequency selectivity and amplitude accuracy, a window type with better selectivity might be better for generic spectrum analysis (i.e. what's where in spectrum).

Test and Measurement Fundamentals video series on the Rohde & Schwarz YouTube channel:  https://www.youtube.com/playlist?list=PLKxVoO5jUTlvsVtDcqrVn0ybqBVlLj2z8
 
The following users thanked this post: Performa01, BRZ.tech

Offline RAPo

  • Frequent Contributor
  • **
  • Posts: 673
  • Country: nl
Re: Siglent SDS800X HD Review & Demonstration Thread
« Reply #186 on: March 11, 2024, 12:01:02 pm »
Ham Test


General Remark: I don’t maintain a YouTube channel and my time is limited. Since I’ve already published most of the intended content, and I made sure the relevant information can easily be found by means of the table of contents in the opening posting, I don’t mind people asking questions here, even newbie questions 😉

Thanks for your knowledge and insights. They're really appreciated. This thread convinced a Rigol-fan boy to order a Siglent!
 
The following users thanked this post: Performa01, 2N3055, BRZ.tech

Offline gf

  • Super Contributor
  • ***
  • Posts: 1302
  • Country: de
Re: Siglent SDS800X HD Review & Demonstration Thread
« Reply #187 on: March 11, 2024, 12:13:10 pm »
SDS824X HD_SA_CW_146MHz_1mV

We can see that the vertical position is not constant across the screen width, which hints on the noise that gets very noticeable at such low signal levels.

Theoretically, a bandpass filter could help to reduce noise in the time domain display. The handbook sais that 200 FIR taps are supported. With 200 taps @2Gsa/s you can design filters with ENBW down to 10 MHz (see attachment). For the provided 500µV/div noise floor data, this would improve the 0..1GHz SNR by ~16dB. Is it actually possible to specify/upload arbitrary custom filter taps, or are only the predefined filters supported? The latter seem to be a bit limited (e.g. bandpass passband >= 0.02 * sample_rate).
« Last Edit: March 11, 2024, 12:17:14 pm by gf »
 
The following users thanked this post: Performa01, egonotto, Mortymore, BRZ.tech

Online mawyatt

  • Super Contributor
  • ***
  • Posts: 3511
  • Country: us
Re: Siglent SDS800X HD Review & Demonstration Thread
« Reply #188 on: March 11, 2024, 02:26:03 pm »
@Performa01

Superb work, well done :clap:

You nicely show the inherent built-in capability of this new highly affordable Analytical Instrument we disrespectfully call a "Scope"!!

Also like the use of the "Trick", reminiscent of our 80s multi-tier DTCA CCD based RTSA, this technique seemed lost in time!!

We thought/hoped Siglent might "answer" Rigol's excellent DHO800 introduction, they've certainly answered that "call"  ;)

Edit: Added in

Best,
« Last Edit: March 11, 2024, 03:50:40 pm by mawyatt »
Curiosity killed the cat, also depleted my wallet!
~Wyatt Labs by Mike~
 
The following users thanked this post: Performa01, 2N3055, BRZ.tech

Online Performa01Topic starter

  • Super Contributor
  • ***
  • Posts: 1686
  • Country: at
Re: Siglent SDS800X HD Review & Demonstration Thread
« Reply #189 on: March 11, 2024, 02:32:03 pm »
I was forced to use the Blackman window, which is still usable for spectrum analysis with a max. amplitude error of 1 dB. Its resolution bandwidth is not that much better than Flattop hence the picture isn’t very useful and we only get a vague idea of the FM spectrum.

Again, many thanks for the detailed analysis - if you don't already work for a T&M manufacturer, you really ought to consider it :)

Quick question: which window types does the Siglent support?   

I'm not sure I would have used a Blackman(-Harris) window here, although I presume this is the default (at least it's the default on a lot of scopes).  Since you're going to have to trade between frequency selectivity and amplitude accuracy, a window type with better selectivity might be better for generic spectrum analysis (i.e. what's where in spectrum).

No, Blackman is not default, I think it's Hanning (correctly: "von Hann"), and unfortunately so, because many folks not really understanding how to properly setup a FFT stick to the default and - quite frankly - everything but Flattop is pretty useless for spectrum analysis. I thought I made it clear that I have used Blackman because it is the only other acceptable window with max. 1 dB amplitude error, which has at least a little bit narrower bandwidth.

The reason for this hard assessment together with the answers to your questions can be found here:

https://www.eevblog.com/forum/testgear/siglent-sds2000x-plus-coming/msg4318822/#msg4318822
 
The following users thanked this post: egonotto, core, BRZ.tech

Offline pdenisowski

  • Frequent Contributor
  • **
  • Posts: 779
  • Country: us
  • Product Management Engineer, Rohde & Schwarz
    • Test and Measurement Fundamentals Playlist on the R&S YouTube channel
Re: Siglent SDS800X HD Review & Demonstration Thread
« Reply #190 on: March 11, 2024, 02:49:28 pm »
No, Blackman is not default, I think it's Hanning (correctly: "von Hann"), and unfortunately so, because many folks not really understanding how to properly setup a FFT stick to the default and - quite frankly - everything but Flattop is pretty useless for spectrum analysis. I thought I made it clear that I have used Blackman because it is the only other acceptable window with max. 1 dB amplitude error, which has at least a little bit narrower bandwidth.

The reason for this hard assessment together with the answers to your questions can be found here:

https://www.eevblog.com/forum/testgear/siglent-sds2000x-plus-coming/msg4318822/#msg4318822

Thanks for the link.  Perhaps I'm misunderstanding you (or you're speaking tongue-in-cheek), but I would however rather strongly disagree that "everything but Flattop is pretty useless for spectrum analysis"  It very much depends on the application (i.e. what kinds of signals you're looking at).  Even if amplitude accuracy is your primary concern, there are still multiple window types that provide "acceptable" amplitude accuracy in many applications.

The fact that various window types exist (and all modern T&M FFT implementations support multiple window types) speaks to the need for different windows :)

I'm working on my own presentation / video covering this, but in the meantime there is an excellent (and accessible) coverage of FFT windowing in this paper

https://www.egr.msu.edu/classes/me451/me451_labs/Fall_2013/Understanding_FFT_Windows.pdf   (see page 4)

Or a little more technical:

https://www.ti.com/content/dam/videos/external-videos/2/3816841626001/5834902778001.mp4/subassets/adcs-fast-fourier-transforms-and-windowing-presentation-quiz.pdf  (see slide 10)
« Last Edit: March 11, 2024, 02:52:44 pm by pdenisowski »
Test and Measurement Fundamentals video series on the Rohde & Schwarz YouTube channel:  https://www.youtube.com/playlist?list=PLKxVoO5jUTlvsVtDcqrVn0ybqBVlLj2z8
 
The following users thanked this post: Performa01, egonotto, Mortymore, core, orzel, mawyatt, RAPo, BRZ.tech

Online mawyatt

  • Super Contributor
  • ***
  • Posts: 3511
  • Country: us
Re: Siglent SDS800X HD Review & Demonstration Thread
« Reply #191 on: March 11, 2024, 04:03:43 pm »
Good elementary FFT Windowing references  :-+

A priori signal type and post measurement intent certainly helps with proper Window selection, sort of a "Matched Filter" type representation!!

Best,
« Last Edit: March 11, 2024, 04:12:10 pm by mawyatt »
Curiosity killed the cat, also depleted my wallet!
~Wyatt Labs by Mike~
 
The following users thanked this post: egonotto, pdenisowski

Offline pdenisowski

  • Frequent Contributor
  • **
  • Posts: 779
  • Country: us
  • Product Management Engineer, Rohde & Schwarz
    • Test and Measurement Fundamentals Playlist on the R&S YouTube channel
Re: Siglent SDS800X HD Review & Demonstration Thread
« Reply #192 on: March 11, 2024, 04:44:48 pm »
A priori signal type and post measurement intent certainly helps with proper Window selection, sort of a "Matched Filter" type representation!!

That's a great way of putting it.  In my experience, customers often don't (necessarily) know the frequency domain characteristics of their signal in advance, so choosing an FFT window is still sometimes a trial-and-error process.

I'm guessing (because I haven't read it ... mea culpa) that the Siglent documentation is much like most other documentation in that it lists the FFT window types but provides very little practical guidance about when to use one window type instead of another (and/or guidance about how to recognize when you're using the wrong window type for the signal you are measuring).
Test and Measurement Fundamentals video series on the Rohde & Schwarz YouTube channel:  https://www.youtube.com/playlist?list=PLKxVoO5jUTlvsVtDcqrVn0ybqBVlLj2z8
 
The following users thanked this post: egonotto, BRZ.tech

Offline ebastler

  • Super Contributor
  • ***
  • Posts: 6676
  • Country: de
Re: Siglent SDS800X HD Review & Demonstration Thread
« Reply #193 on: March 11, 2024, 04:53:15 pm »
It's actually a tad better than that, and describes the frequency resolution vs. amplitude "resolution" properties of the various window functions. See the relevant table from the SDS800X HD manual attached.

 
The following users thanked this post: Electro Fan, 2N3055, pdenisowski, orzel, mawyatt, BRZ.tech, radiohomebrewer2000

Online Performa01Topic starter

  • Super Contributor
  • ***
  • Posts: 1686
  • Country: at
Re: Siglent SDS800X HD Review & Demonstration Thread
« Reply #194 on: March 12, 2024, 11:59:40 am »
Filter Demo

There was the suggestion for cleaning up high frequency narrowband signals by means of a bandpass filter. In this case we are talking about the 146 MHz signal from the HAM Test demo.

The narrowest bandwidth achievable at 146 MHz is 40 MHz (126-166 MHz). This appears very wide, but is pretty effective nevertheless. Just look at the noise floor:


SDS824X HD_Math_FFT_BP_126-166MHz_Noise

The screenshot above shows two math channels with FFT plots; F4 is the original signal (which is just the frontend noise for now), whereas F1 shows the result of the filter operation performed in math channel F2. It should be immediately obvious that getting rid of the strong 1/f-noise below 300 kHz alone would help a lot. With the BP-filter, only at 1 kHz the 1/f-noise approaches the level of the original HF-noise (~-120 dBm).

We cannot expect a major improvement for FFT measurements, because the resolution bandwidth there is much narrower than our bandpass-filter anyway. Here is the FFT with the 1 mVrms signal at 146 MHz applied:


SDS824X HD_Math_FFT_BP_126-166MHz_1mV

Yes, there actually is a difference. The original signal is measured ~0.43 dB too high because of the noise, resulting in -46.57 dBm, see F4 Markers List. On the other hand, the filtered version of that signal measures -47 dBm almost spot-on, as can be seen from F1 Markers List. So yes, even the FFT measurements can benefit from a cleanly filtered signal.

Now let’s have a look at the time-domain, where the improvement because of the filter should be even more obvious:


SDS824X HD_Math_BP_126-166MHz_1mV

Advanced automatic measurements have been set up for the amplitudes of both the original signal and its filtered version. The visual difference is quite striking already, and the measurements confirm the improvement: just like with the FFT, automatic measurements are more accurate with filter than without.

We already know that reliable triggering is only possible down to about 400 µVrms, yet it still works with 100 µVrms signals, if we can accept a high failure-rate (look at the trigger frequency counter):


SDS824X HD_Math_BP_126-166MHz_100uV

Once again, the visual difference is quite striking, and even though the automatic measurements for both signal variants aren’t entirely accurate, there is still a major improvement with the filtered version.

« Last Edit: March 12, 2024, 12:01:46 pm by Performa01 »
 
The following users thanked this post: Electro Fan, egonotto, Mortymore, gf, Martin72, core, orzel, trackersoft, BRZ.tech, radiohomebrewer2000

Offline Veteran68

  • Frequent Contributor
  • **
  • Posts: 727
  • Country: us
Re: Siglent SDS800X HD Review & Demonstration Thread
« Reply #195 on: March 12, 2024, 03:35:42 pm »
As the thread is currently 8 pages and still under 20 people have the ability to select "All" at the top of the page to open all of the existing pages and then print as a hard copy or save as a pdf for reference, don't forget the images though. You won't find this level of information in any user manual that's for damn sure.

I agree this is a level and quality of documentation that deserves to be immortalized in a document format like PDF. To that end, I spent some time this morning using a browser extension I'm fond of that lets you "clean" a web page to make it more suitable to printing and/or saving as PDF. I stripped out all of the forum decorations/controls and as much of the back and forth dialog, Q&A, and other noise as I could to keep it limited to the documentation type posts and screenshots provided by Performa01, rf-loop, and others. Of course where a question resulted in further exposition and educational presentation, I kept that. I may have scrubbed (inadvertently or intentionally) some useful details or interactions here and there, as it turned out to be a larger chore than I expected and had to drop and come back to it multiple times in between work stuff (yes, I did this while at work, lol).

If/when more such content is added to the thread, it won't be hard to edit the PDF to append the new info. It's not perfect, and it's not paginated, but it is searchable and it's cleaner than a raw forum dump.

I was going to host it somewhere, then realized that if I zipped it, it came to just under the 8000KB attachment limit for the forum. So I've attached it here ZIP'ed for now. If it grows much larger, we can find a host for it later. I have Google Drive, OneDrive, Box, Dropbox, as well as some personal web hosting space that I could use. Not to mention the free file hosting services.
 
The following users thanked this post: egonotto, Grandchuck, Martin72, core, RAPo, BRZ.tech, bte, Wictorsson

Offline BRZ.tech

  • Regular Contributor
  • *
  • Posts: 51
  • Country: br
Re: Siglent SDS800X HD Review & Demonstration Thread
« Reply #196 on: March 12, 2024, 09:45:56 pm »
Ham Test

Here come some tests that could be of interest for HAM operators.


Hi,
@Performa01
I am very grateful about your amazing analysis of CW-AM-FM for the HAM universe. TKS.

I have another question that I consider relevant to the HAM universe, which is the Frequency Response of the SDS800X HD for Square Wave Excitation.
It is very interesting for HAMs when it comes to making RX-TX in Digital Modes, in various RF bands, where HAMs DIY artisanal new low power RF radios, called QRP, for the frequencies authorized by legislation, on each country or region.
And the analysis of Digital Signals in the time regime and frequency regime is very welcome for HAM users. And I'm sure the SDS800X HD will literally be able to supply the most important measurements.
In this topic, I looked in the index, in the first post, and I didn't find the Frequency Response for Square Wave Excitation.

"Any colleague on the topic can also answer my questions, they will be welcome."

I suggest you do a test to measure a signal, which we can use in HAM, a SQUARE WAVE signal f=50.000MHz, without modulation, Amplitude = 0 to 1Vpp, at 50 Ohm, to start, and increase the frequency, to have the minimum number of tracks that you think are necessary in the FFT of the SDS800X HD, for the cutoff frequency that you consider sufficient for the BW.

On the FFT screen where you found BW, in the “FFT Table”, locate the Frequencies and Amplitudes of the Fundamental and Harmonics, and set up an equation in time of f(t), with the coefficients and sines and cosines, of the sum Fourier Series: A0, An, Bn. (I put them in UPPERCASE characters for emphasis, but they are lowercase characters).

I have read many “Theoretical Articles” and I have seen many “Videos” on Youtube, which theoretically calculate the “Fourier Series Coefficients”, but without the practical part, of collecting the coefficients from the FFT Table, and inserting them into f(t).
Next, a video that I thought was excellent, about the calculation of the “Fourier Series Coefficients” presented by “Professor Michel van Biezen”:


At the end of the video, he presented the conclusion, with f(t) with (DC Value = A0), the Fundamental and the Third and Fifth Harmonics.
At the end of the test, the “Fourier Series Coefficients” collected from the “FFT Table” of the SDS800X should be very close to those presented by “Professor Michel van Biezen”.
There is the question that how the “Fourier Series Coefficients” in their Amplitude values should be presented in the f(t) equation: Vpp, Vrms, Vp, or other??
You can present the images in the Time domain, and also in the Frequency domain, using the FFT with the Table, it can be in dBm.
And present your conclusions to the HAM universe.
TKS.
73.
 

Offline maxwell3e10

  • Frequent Contributor
  • **
  • Posts: 870
  • Country: us
Re: Siglent SDS800X HD Review & Demonstration Thread
« Reply #197 on: March 12, 2024, 10:58:29 pm »
Thank you for providing so many detailed measurements. I am wondering if you can test the averaging and ERES math features, which are not described in detail in the manual. Basic questions are what is the maximum number of averages, does it allow finite and running average, how much does averaging or ERES slow down update rate?
 

Offline tautech

  • Super Contributor
  • ***
  • Posts: 28890
  • Country: nz
  • Taupaki Technologies Ltd. Siglent Distributor NZ.
    • Taupaki Technologies Ltd.
Re: Siglent SDS800X HD Review & Demonstration Thread
« Reply #198 on: March 12, 2024, 11:54:25 pm »
Some screenshots from SDS814X HD via PC for your study.
Probe comp output.
Avid Rabid Hobbyist.
Siglent Youtube channel: https://www.youtube.com/@SiglentVideo/videos
 
The following users thanked this post: Performa01, core

Online Performa01Topic starter

  • Super Contributor
  • ***
  • Posts: 1686
  • Country: at
Re: Siglent SDS800X HD Review & Demonstration Thread
« Reply #199 on: March 13, 2024, 06:30:14 pm »
Fun with Square Waves

I have another question that I consider relevant to the HAM universe, which is the Frequency Response of the SDS800X HD for Square Wave Excitation.

And the analysis of Digital Signals in the time regime and frequency regime is very welcome for HAM users. And I'm sure the SDS800X HD will literally be able to supply the most important measurements.
In this topic, I looked in the index, in the first post, and I didn't find the Frequency Response for Square Wave Excitation.
The frequency as well as pulse response of the SDS800X HD have been presented in some detail in the opening posting (sections “Bandwidth” and “Pulse Response”). Why do you think you need a special frequency response for square waves?

You’re talking about Fourier and point to a video showing how to derive the well-known Fourier coefficients for a square wave. Maybe these all too theoretical approaches still don’t convey the fundamental insight that the fidelity of a square wave reproduction on the oscilloscope screen depends on the rise time of the square wave and the bandwidth of the scope. The scope bandwidth is known, whereas our task now is to find the rise time a 200 MHz DSO can handle smoothly.

Okay, let’s recap some fundamentals.

Even with moderate 3.5 ns rise time, the pulse spectrum extends up to >800 MHz – look at the spectrum in the screenshot below (for this I pulled out a heavier gun with 2 GHz bandwidth):


Ref-Spec_Square_3.5ns_10MHz

Of course, a fast scope like this reproduces a comparatively slow rise-time like this flawlessly. We can see that with 210 MHz bandwidth we could expect a decent reproduction of this signal with no more than ~1% aberrations, because all harmonics down to -40 dBc would be included. With 250 MHz bandwidth (which the SDS824X HD nearly has with up to 2 channels in use), the expected aberrations would be even lower at about 0.3%, as all the harmonics down to -50 dBc would be included.


I suggest you do a test to measure a signal, which we can use in HAM, a SQUARE WAVE signal f=50.000MHz, without modulation, Amplitude = 0 to 1Vpp, at 50 Ohm, to start, and increase the frequency, to have the minimum number of tracks that you think are necessary in the FFT of the SDS800X HD, for the cutoff frequency that you consider sufficient for the BW.
Well, let’s see what a 50 MHz square wave would look like if we stick to a rise-time of 3.5 ns, which would be adequate for the SDS824X HD:


SDS824X HD_Square_3.5ns_50MHz

Yes, this is a perfectly flawless rendering of the square wave with 3.5 ns rise time, as also quite accurately measured by the SDS824X HD. A Look at that picture enables us to predict how an even faster square wave would look; here’s an example for 80 MHz:


SDS824X HD_Square_3.5ns_80MHz

Right, there’s almost a pure sine left. With just 3.5 ns rise time, we cannot expect anything better.

Of course, we can use a faster rise time, like 1 ns, which clearly is a bit fast for a 200 MHz DSO:


SDS824X HD_Square_1ns_80MHz

Overall, the result doesn’t look bad – it just can’t properly characterize the original signal as the rise time measurement is totally off and approaches that of the DSO itself. The signal shape is just what to expect from a bandwidth limited square wave signal. The amplitude measurement is still pretty accurate though.

I hope it is now clear that it’s not the frequency of a square wave, but its rise time, which makes all the difference.


At the end of the test, the “Fourier Series Coefficients” collected from the “FFT Table” of the SDS800X should be very close to those presented by “Professor Michel van Biezen”.
There is the question that how the “Fourier Series Coefficients” in their Amplitude values should be presented in the f(t) equation: Vpp, Vrms, Vp, or other??
You can present the images in the Time domain, and also in the Frequency domain, using the FFT with the Table, it can be in dBm.
I did not watch that video to the end, sorry. The Fourier series for standard waveforms are well-known, so we need no educational video for that.

Well, let’s start with the reference again. What does the 80 MHz square wave with 1 ns rise time look on a DSO that is actually fast enough to handle it?


Ref-Spec_Square_1ns_80MHz

Of course, it all starts with the fact that the square wave itself is far from textbook-perfect. The spectrum contains also even harmonics with a constant level of about -55 dBc, even though there shouldn’t be any at all. We can also see aberrations in the time domain, most obviously a little overshoot, hence we cannot expect a good conformity with the theoretical values.

The Fourier series for a rectangular wave is like 2 * A / Pi * (h1 + h3 / 3 + h5 / 5 + h7 / 7 …);

In the example above, the amplitude is 0.6 V, so the term in front of the parenthesis is 2 * 0.6 / Pi = 0.38197 Vp;

We should now be able to calculate the individual harmonics:
h1 = 0.38197 Vp = -11.37 dBV;
h3 = 0.38197 Vp / 3 = 0.127 Vp = -20.91 dBV;
h5 = 0.38197 Vp / 5 = 0.0764 Vp = -25.35 dBV;
h7 = 0.38197 Vp / 7 = 0.0546 Vp = -28.27 dBV;
h9 = 0.38197 Vp / 9 = 0.0424 Vp = -30.45 dBV;

If we compare this to the Peak Table in the above screenshot, we get the following list:

Freq.   Calculated   Measured   Deviation
[MHz]   [dBV]    [dBV]      [dB]
80   -11.37   -11.535   -0.165
240   -20.91   -21.786   -0.876
400   -25.35   -28.153   -2.803
560   -28.27   -34.581   -6.311
720   -30.45   -42.963   -12.513

The fundamental at 80 MHz is pretty close to the theory, also the third harmonic at 240 MHz is not too far off. Yet all the higher harmonics are increasingly attenuated. Well, no wonder – the textbook calculates the Fourier coefficients for ideal square waves with zero rise time!

What we want to do now, is not comparing a less than perfect square wave, captured with the SDS824X HD, to some textbook theory, but rather with the reference. The outcome is only all too predictable: at 80 MHz the measurement result will be similar, at 240 MHz almost 3 dB too low and drop off pretty quickly at even higher frequencies.


SDS824X HD_Square_3.5ns_80MHz

Yes, the prediction comes true.

Freq.   Calculated   Measured   Deviation
[MHz]   [dBV]    [dBV]      [dB]
80   -11.37   -11.827   -0.457
240   -20.91   -24.514   -3.6
400   -25.35   -40.954   -15.6

Unexpectedly, the level for the even order harmonics is a little bit higher too, with -44 dBc for the 2nd harmonic.

Verdict: this is a nominal 200 MHz instrument. The true 3 dB bandwidth is somewhere at 245 MHz, as long as we don’t activate more than two channels at the same time. The specified rise time is 1.8 ns, actually it is better than 1.5 ns. It has been shown that the SDS824X HD can handle pulses with 1 ns rise time, even though it cannot fully characterize them. The comparison of the Fourier series from the textbook with the real measurements was nothing more than a little fun, because in the real world a perfect square wave doesn’t exist.

And the most important part: the frequency of a square wave is only important because it also dictates the maximum rise time of the signal. For instance, we cannot have a 200 MHz square wave with just 3.5 ns rise time. Other than that, especially for digital communications, we don’t need excessive bandwidth – just enough to capture the relevant part of the modulation spectrum, which has to be bandwidth limited at the transmitter side anyway. Sections “SPI Speed Test” and “The 200 Mbps SPI challenge” deal with fast digital signals, and as the title already reveals, it is possible to handle 200 Mbps communication with the SDS824X HD – just 245 MHz bandwidth are enough for that.

« Last Edit: March 14, 2024, 05:50:42 am by Performa01 »
 
The following users thanked this post: egonotto, newbrain, 2N3055, Mortymore, Martin72, core, orzel, BRZ.tech, gitm


Share me

Digg  Facebook  SlashDot  Delicious  Technorati  Twitter  Google  Yahoo
Smf