Made a Python script to control the DP832 for curve tracing.

The advantage of a DP800 power supply is that:
- DP832 and other DP800 series power supplies can be controlled remotely
- can set votlages and currents with mV and mA resolution (and accuracy, too, if calibrated)
- has 2-3 output channels, like it would be 2-3 different power supplies in one instrument
- has automated switching from CV to CC mode
- has adjustable over voltage and over current protection for each channel output
- can measure its own voltage, current and power for each channel
That will be enough to automate voltage/current setting and reading in order to trace some I-V plots using nothing but a program and some alligator clip wires to connect the component under test.
For now I only used it for MOSFET curve tracing:
- connect the GS of the MOSFET to channel 1 (CH1) of the DP832, and the DS to CH2
- open the control script and set the desired parameters, for example the Vgs max, Id max, etc.
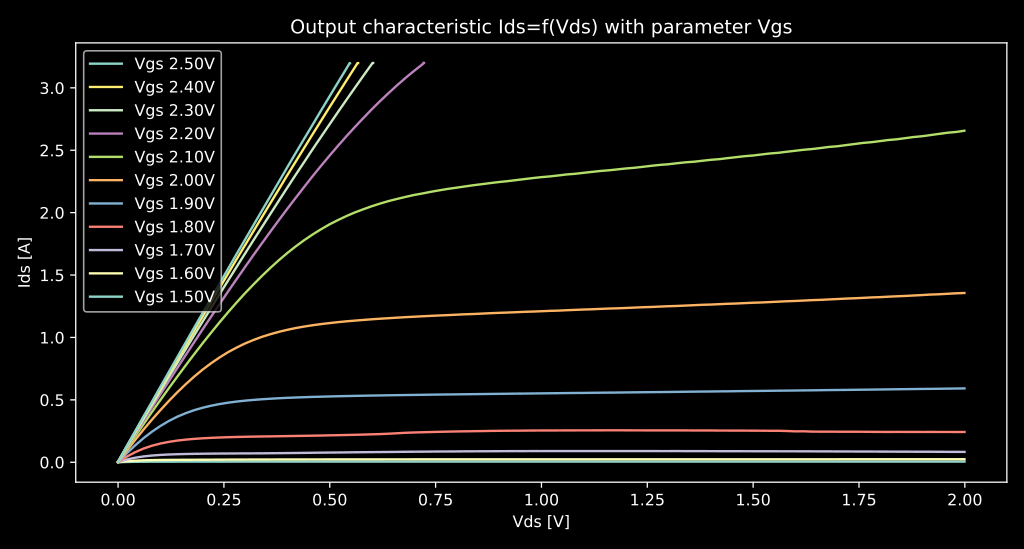
- run the curve tracer script and the result should look like this on the screen (also saved on disk):
The control script 'dp832_curve_tracer_v0.ipynb' attached was made in Jupyter Lab using Python, PyVISA, Numpy and Matplotlib, all FOSS, should work on any OS but I've tested it with Linux only, on a Kubuntu 20.04 LTS.

The upper cell has most of the configurable parameters of the curve tracer.


