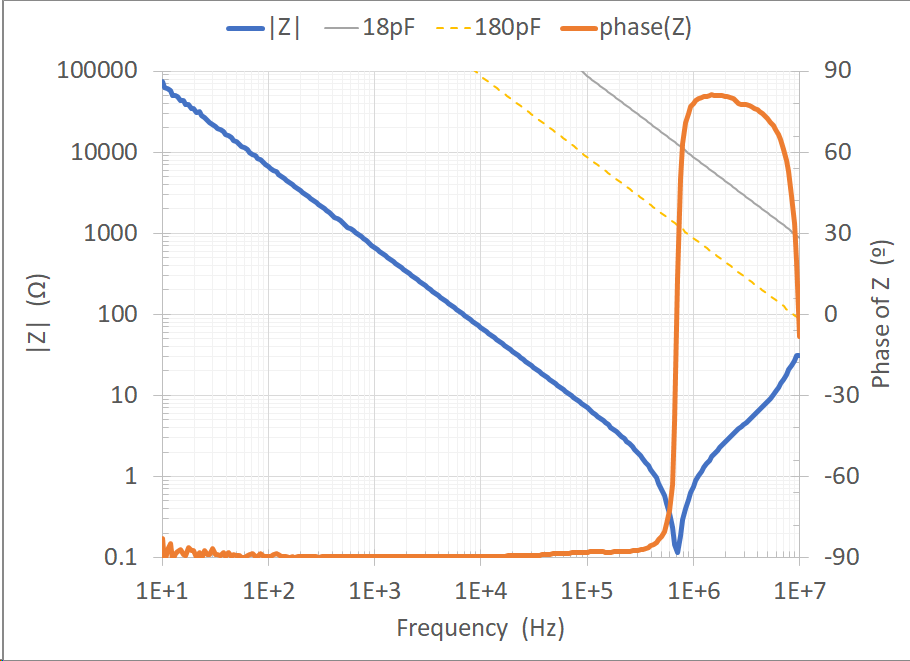
Here is an example impedance curve I measured using the set-up described in the video.
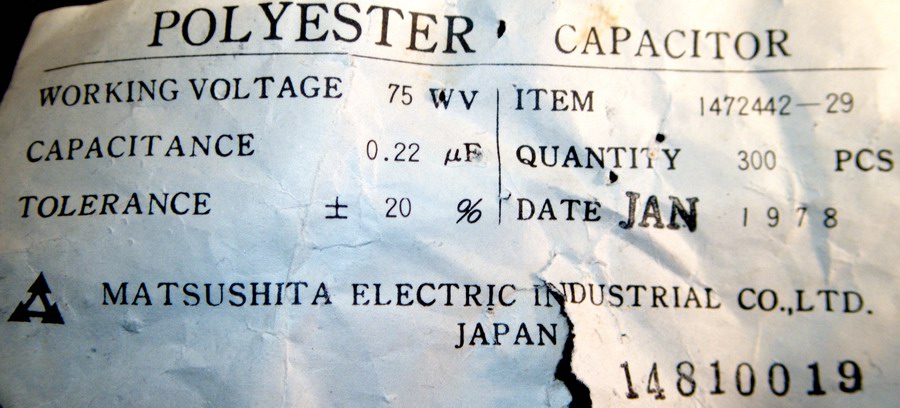
This is the label on the 41 year old bag of capacitors:
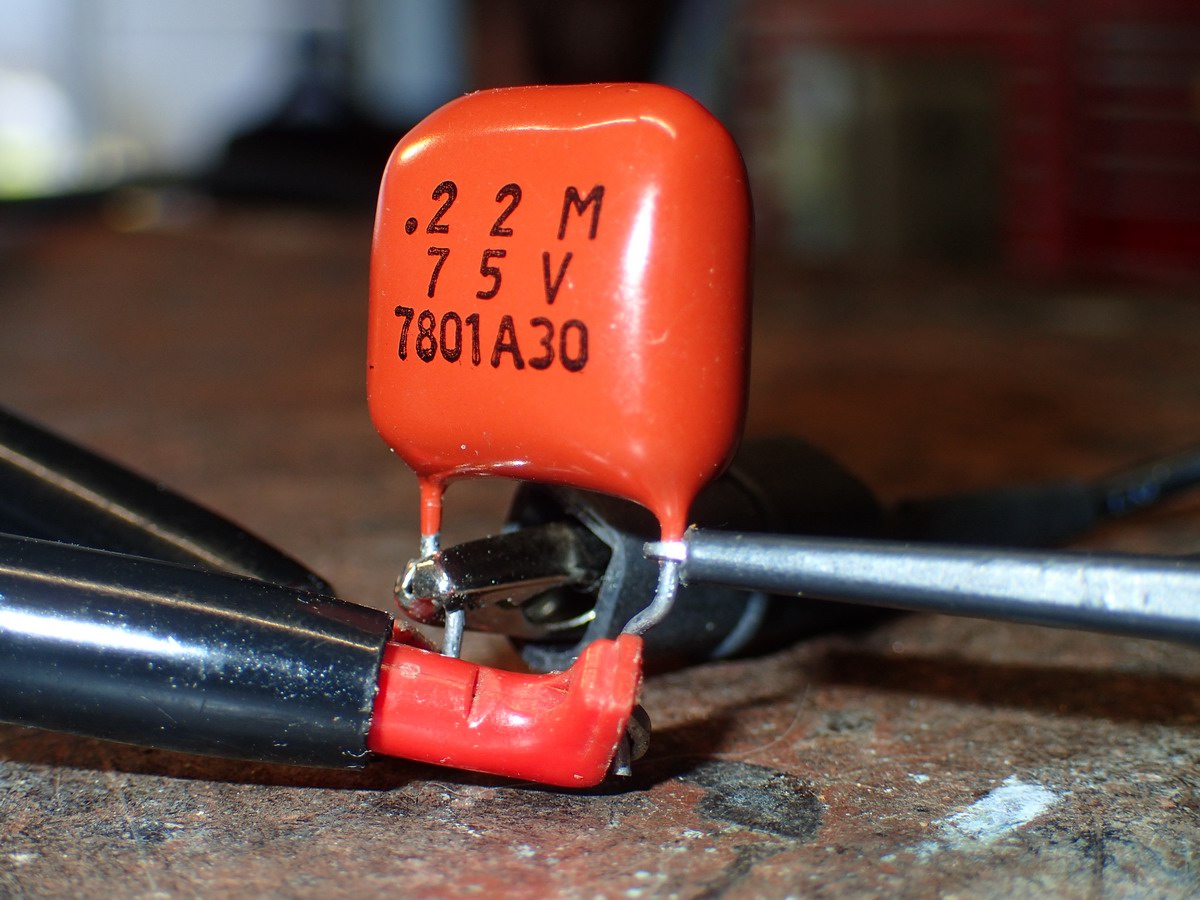
This is the capacitor being measured. You can see the oscilloscope probe connected closest to the device and the force leads at the lead tips.
This is the capacitor impedance curve showing a self resonance frequency of 700KHz.
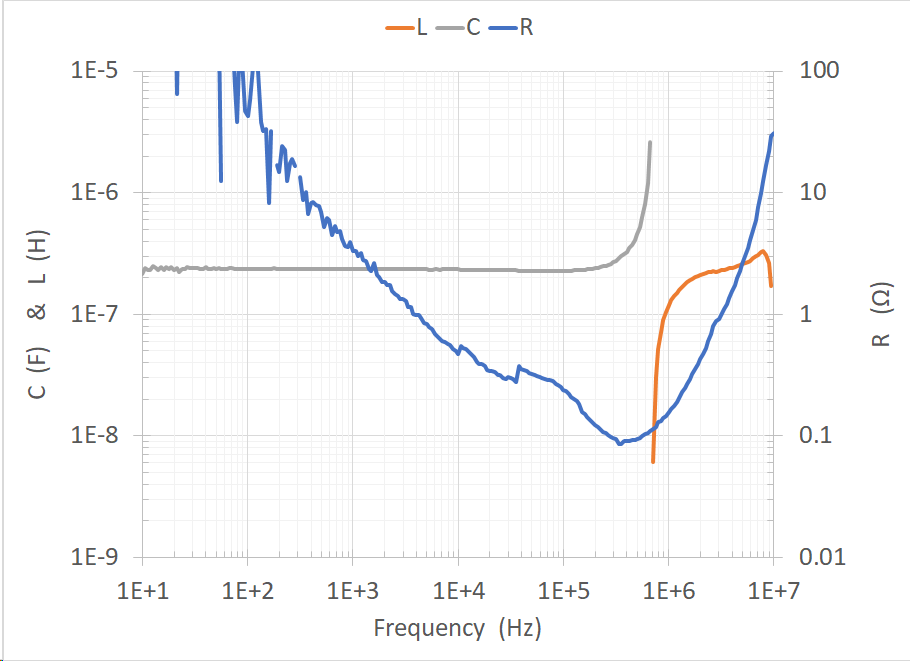
These are the series R, L, and C values calculated at each frequency from |Z| and phase(Z).
It shows the measured capacitance is the nominal 0.22µF. The ESR at resonance is ≅0.12Ω which matches the minimum of the |Z| curve. The ESL is ≅220nH which is the same value you would get from calculating it from the resonance.
Chris


