V1.44 is up
The main feature is the GridPanel, another feature is that scripts can now ask for a color.
Added: GridPanel, this is a customable interface to all connected devices.
Added: unit... to access the unit for a device value.
Added: tabelColumnUnit and tableColumnFormat to access the unit and formatter for a table column
Added: #PopupColor to the input fields, this makes it possible to input a color in the popup.
Added: time/dateTime names on chart can now be overwritten like any scale name
Added: Count/Percent names on histogram can now be overwritten like any scale name
Added: #ChartReset command, Will undo coloring and scale renames/synchronization and title overrides.
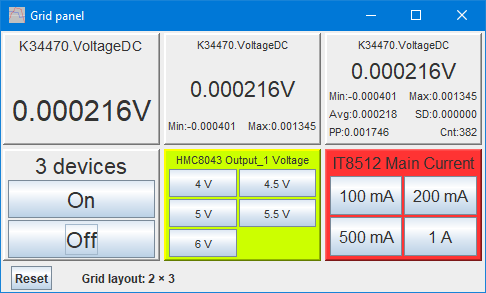
The GridPanel and SinglePanel is a user customizable interface, it is a grid where different panels can be added. Each panel can either be a readout or a control panel and will have a customable options. The idea is to make a panel for a specific task and then save it to a menu entry: Right click on the log window and select "Generate script", "Grid panel"
These panels are not linked to logging, but will work with or without logging active and the statistic on the panels do not track other statistics on TestController, it will be very similar, but not necessary exactly the same, due to difference in sample rate and samples.
The current type of panels are:
3 readouts with more or less statistic, they work for all devices and do not require a advanced bench meter to show statistic.
A single device on/off (This function requires that the "setOn" interface is implemented for the device).
Multi devices on/off, all selected devices will be turned on/off simultaneously
A parameter "setter", select a device setting and add buttons for the required settings.
Here is the default size of the panel:

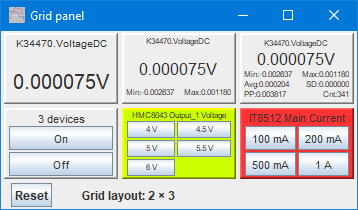
But it can be scaled up/down over a wide range, it is also possible to change number of rows and columns:

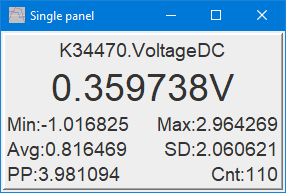
A readout broken out into a single panel (Any panel can be broken out into a "Single panel" that is a resizable stand-alone window):

I am working on many more panels with different functions, one is a small chart.
Ideas for panel types are also welcome.