V1.40 is up
This is mostly extension to charting and it only works from scripts.
V1.40
Added: #removePromptChars to SCPIx driver
Added: ATorch USB, general support for USB protocol, may later be change to one or more model names
Added: ATorch AT3010 AC energy meter for panel mounting
Added: ATorch DL24P DC load
Changed: Bar drawing on histogram, they will now be plain when more than 100 bins are used.
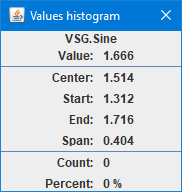
Added: Values popup to histogram
Fixed: Missing header when saving histogram, header will only be used for one histogram, not for two or tree.
Added: #chartAnnotate add lines, arrows and text to a chart.
Added: #chartScaleSync makes it possible to share a scale between multiple curves
Added: #chartBackground customize colors for the different elements in the chart.
Added: #chartColors customize a new set of curve colors
Added: #chartScaleName change the displayed scale name on the chart
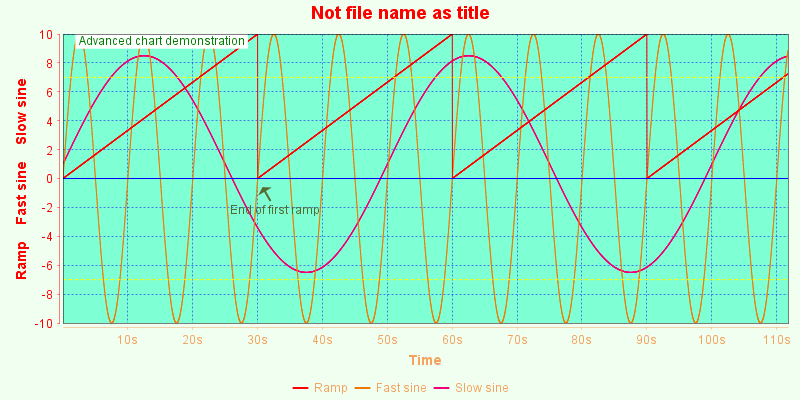
I used this script to generate the above (From already loaded data):
#chartTitle "Not file name as title"
#chartBackground aquamarine honeydew blue sandybrown red
#chartcurves VRG.Ramp VSG_1.Sine VSG_2.Sine
#chartScaleSync VRG.Ramp VSG_1.Sine VSG_2.Sine
#CHARTCOLORS (255,0,0) (240,120,0) (240,0,120)
#CHARTSCALENAME VRG.Ramp Ramp
#CHARTSCALENAME VSG_1.Sine "Fast sine"
#CHARTSCALENAME VSG_2.Sine "Slow sine"
#chartannotate line 0 0 130 0 blue 1
#chartannotate line 0 7 130 7 yellow 1 "... "
#chartannotate line 0 -7 130 -7 yellow 1 "... "
#chartannotate arrow "End of first ramp" 30 0 60 darkolivegreen 2
#chartannotate text "Advanced chart demonstration" lb 2 9 green 2 white
#saveChart aa.png
I was asked about a cursor in histogram mode, it is possible now with a value popup:
The Atorch functions is not really tested and according to dirkwim07 I need to change the type of serial port. When I get some more feedback on ATorch I will adjust the definition.


