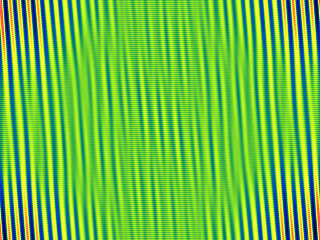
Right, had some fun with FFTs just to see what we can see with regard to banding, vignetting, etc. Turns out that indeed you can see that in the spectral domain.
cal_norm.png mrflibble-E4-spectral.png
 mrflibble-E4-spectral_cutoff_000.png
 mrflibble-E4-spectral_cutoff_060.png
 mrflibble-E4-convolution_cutoff_060.png
The big spectral blobs near the X-axis in the 1st and 3rd quadrant look to be at about the right spot for the banding seen on the original cal pic.
What was new to me was the high frequency component on the Y-axis. That would seem to suggest that odd rows are slightly different from even rows. There is also a smaller high frequency component on the X-axis, which would indicate odd/even columns also being different but less so than the rows.
After I noticed this I added some stats to check for mismatches in the even/odd rows and columns.
Bad pixel threshold: 4 sdev
Bad pixel count: 62
| MIN MAX MEAN SDEV
-----------------+---------------------------------
Full image | 32150 45489 36041.49 2372.99
Even rows | 32397 45489 36123.39 2369.27
Odd rows | 32150 45074 35959.60 2373.92
Even columns | 32264 45489 36069.75 2379.06
Odd columns | 32150 44516 36013.24 2366.61
Even-Odd mismatch for (ROW,COL): (+163.79 , +56.51)
What that says is that the average of the even rows is quite a bit higher than the average of the odd rows. And same story for the columns, but less so. Which indeed matches my suspicion that maybe the sensor pixel are either grouped by 2 or 4. Or maybe larger groups, haven't checked yet what's the most likely grouping based on stats.
And it also seems that the crappier the sensor the more pronounced the effect.
For example schdiewen's pretty darn awesome E4 looks to be far better in this regard.
schdiewen-E4-spectral.png
Bad pixel threshold: 4 sdev
Bad pixel count: 64
| MIN MAX MEAN SDEV
-----------------+---------------------------------
Full image | 31863 45767 36190.67 2370.90
Even rows | 32117 45408 36196.05 2374.12
Odd rows | 31863 45767 36185.28 2367.69
Even columns | 32117 45201 36208.34 2378.75
Odd columns | 31863 45767 36173.00 2362.93
Even-Odd mismatch for (ROW,COL): (+10.78 , +35.34)
That looks to be one clean sensor... Note the lack of high frequency component. So unlike mine, this sensor looks to be fairly equal for the odd/even rows.
And tomas123's E40 is even better ...
tomas123-E40-spectral.png
Bad pixel threshold: 4 sdev
Bad pixel count: 17
| MIN MAX MEAN SDEV
-----------------+---------------------------------
Full image | 32360 43359 36067.35 2222.82
Even rows | 32360 43265 36065.73 2221.96
Odd rows | 32422 43359 36068.98 2223.71
Even columns | 32360 43265 36074.36 2226.46
Odd columns | 32434 43359 36060.34 2219.19
Even-Odd mismatch for (ROW,COL): (-3.25 , +14.02)
And lucky for me, tomas123's E4 sensor looks to have about the same characteristics as mine. Both in terms of spectral components and also in terms of odd/even rows/cols mismatch. That always helps to verify you're not
just making stuff up.
 tomas123-E4-spectral.png
Bad pixel threshold: 4 sdev
Bad pixel count: 170
| MIN MAX MEAN SDEV
-----------------+---------------------------------
Full image | 32144 47159 36220.38 2537.15
Even rows | 32144 47159 36284.63 2530.87
Odd rows | 32148 46964 36156.13 2541.83
Even columns | 32200 47159 36262.19 2551.62
Odd columns | 32144 47112 36178.56 2521.93
Even-Odd mismatch for (ROW,COL): (+128.50 , +83.63)
I'll just dump the rest in a zip so those interested can grab that, otherwise this post becomes one big picture attachement fest.
 Update:
 well darnit. Zip file too big or something.
