It was not my intention to make you think FFT is crap or the scopes.
I think, from your answers, you have no or not much experience with spectrum analysers.
The big difference is a scope uses the time domain and from that sampled info that makes forinstance a sinewave on your screen it uses FFT to transform this info to the frequency domain.
If we take a sinewave, the DAC meaures the whole signal, it determes amplitude and frequency from it. It is only 8 bit or so ( digital knowledge is not my thing but I have build and restored serveral SAs, digital and anlog) so the info of he harmonics, phsase noise, pm, AM, FM ect is all in the amplitude at one point at time x. All those points form a sinewave trace.
It is like standing in a bar and all people shouting at the same time, or a radio that has no tunig, you receive all stations at the same time. Bij filtering ( ears or software) we can extract one station. But tall that data is decoded by a 8 bit ADC so there is not much info in there.
A spectrum analyser can be seen as a normal receiver, you turn it across the frequencybands and you here station after station but never two at the same time. M
So if you want good details you can tune in on a station, switch to narrow filter and only hear the parts of the music that are 1KHz in tone.
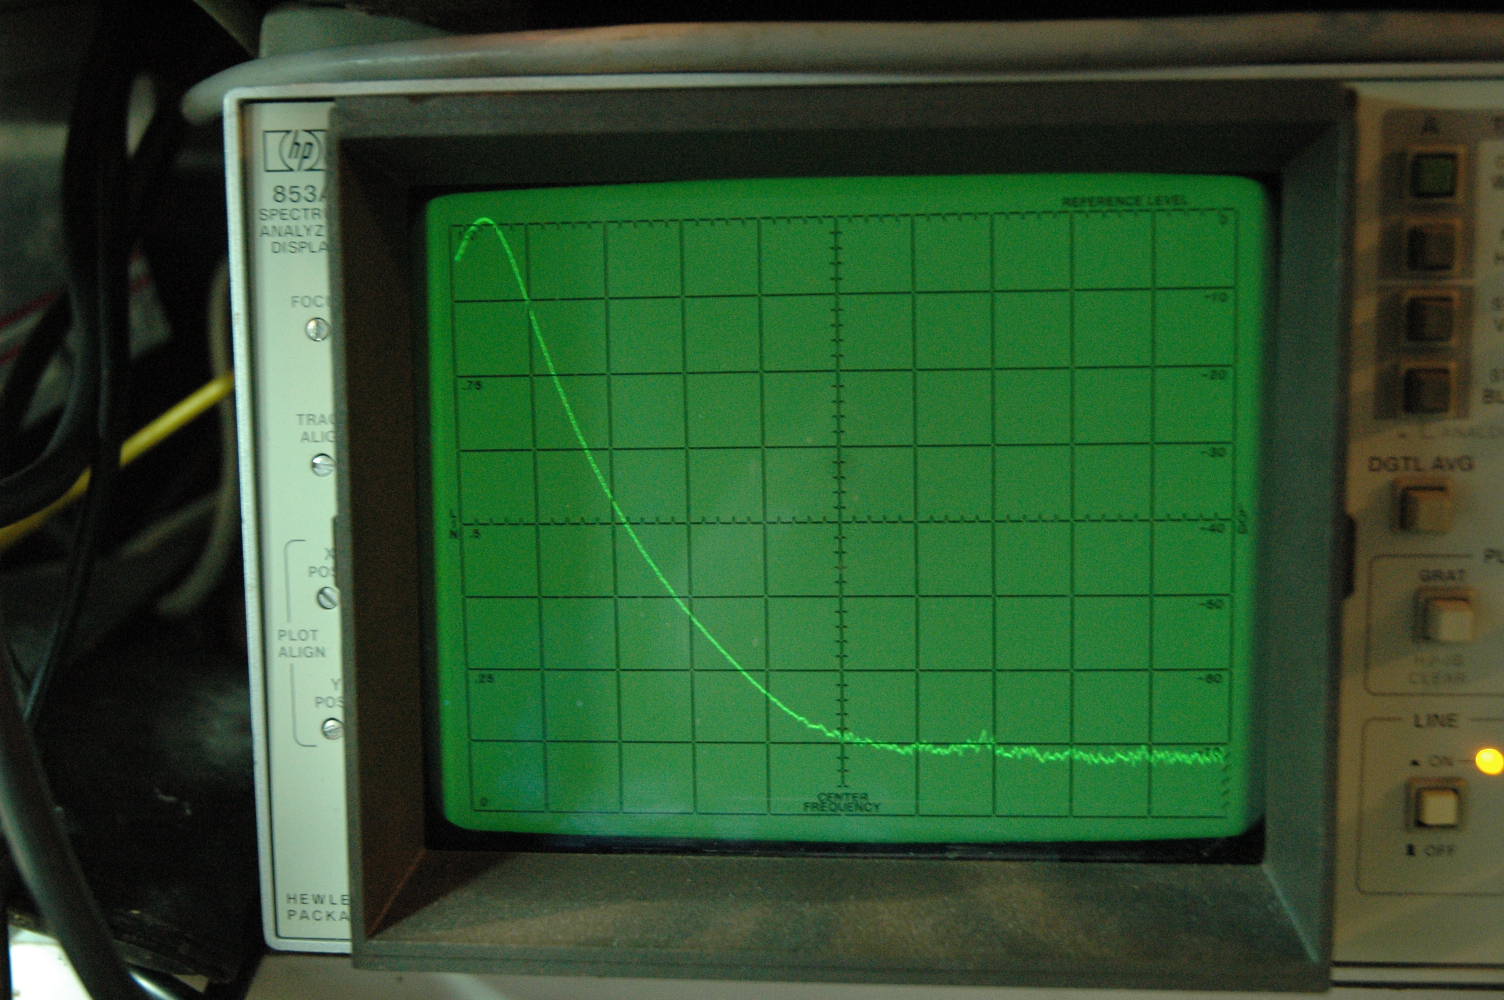
The SA has a sweepgenerator that does the tuning for you. You can choose the sweepwidth, you can choose the filter width. You can look at the phasenoise from a -30 dBm 12,5 MHz carrier while that carrier fills your screen. See picture below.
Now the sinewave again. It sweeps and listens at the first harmonic, uses the full capability of the DAD only for this signal, then it sweep on and reaching the second harmonic it uses the full capability of the DAC to measure the second harmonic.
You see the difference ? 8 bit for the whole spectrum or 8 bits only for one tiny bit of spectrum.
There is a " but" In this. Take two pulses, one at 10 MHz, one at 50 MHz. The happen exact at the same time. They last 10 nS. If they occure just within the sample time of the scope ( not in the dead time) both signals are part of the whole spectrum ( for instance 100MHz (and the attenuated signals outside the bandwidth that still are received) the scope listens too. The software filters transform the signal to frequency and you see the poles growing out of the " grass" ( noisefloor)
But a SA that sweeps at low speed ( like some digital SAs do) are not at teo frequencys at the same time. You can make such a setup by making the pulse repeatble that the SA sweep speed such that it sees the 10 MHz but every time just misses the 50 MHz.
But this is a very extreme situation that would never happen. All SA's were very expensive precision products with very high quality filtering, ultra lownoise amps and very well engineered so bndwidt, sweeptime, filtering was optimised to be sure these things did not happen.
Since a short time there now are cheaper SA's from Rigol. It would be nice to compare one to a real SA to check the performance.
And that is what you want here. You need FFT screenshots from a known signal ( amplitude, phaseniose, harmonics ect) and then compared to the screenshots from a Agilent, Tek, HP or R&S spectrum analyser. Then you can make conclusions.
I can hook up a generator to my Hameg but the screen shot will tell you nothing. You need a reference. I have seen screenshots from the Rigol with intermodulation and strange bumps in th trace but the owner does not have enough knowledge to see if it is a measurement mistake, a bad genertor, overdriving the input amp or just a not to good SA. So the pictures are worthless.
A friend has the Hameg SA and a Tek SA. We compared those and that the Hameg performed very well. My friend is a ex-metrologist who used to work with expensive SAs for a living.
I am now on a short holyday but next week i will make some screenshot compares between FFT and SA for you.
Fred


