Author Topic: Dynamic Load - Bode Plot using HP 35665A DSA  (Read 16221 times)

0 Members and 1 Guest are viewing this topic.

Offline Jay_Diddy_BTopic starter

  • Super Contributor
  • ***
  • Posts: 2764
  • Country: ca
Dynamic Load - Bode Plot using HP 35665A DSA
« on: October 13, 2013, 09:08:24 am »
Hi,

In another thread I have shared the design and construction of a dynamic electronic load.

https://www.eevblog.com/forum/projects/dynamic-electronic-load-project/msg309035/#msg309035

 In this thread I am going to discuss measuring the closed loop-bandwidth using a HP 35665A Dynamic Signal Analyzer.

Theory

The theory behind the technique is that you can inject a small disturbance into a control loop and measure the gain and phase response. In the original thread I performed this in LTspice.


And obtained the following results:


To repeat this measurement with the HP35665A I require a signal injection transformer. I made my own using a 10mH common mode choke as a transformer.

Schematic:


Board Design:


Construction


Test Setup

The HP 35665A was connected to the Dynamic load like this:


The HP 35566A was set for swept sine, Log magnitude, Bode plots.

Here is the measured control loop response:


The markers indicate the loop bandwidth (28.9kHz)  and phase margin (88 degrees). The HP 35665A only allows measurements to 50.5 kHz, so I am unable to measure the gain margin.

The measured control loop response matches the response predicted by LTspice.

Jay_Diddy_B
« Last Edit: October 13, 2013, 09:24:06 am by Jay_Diddy_B »
 
The following users thanked this post: arvidb

Offline Jay_Diddy_BTopic starter

  • Super Contributor
  • ***
  • Posts: 2764
  • Country: ca
Re: Dynamic Load - Bode Plot using HP 35665A DSA
« Reply #1 on: October 13, 2013, 02:33:17 pm »
Hi,

I switch the HP35665A with a HP3577A Network Analyzer. The HP3577A has a frequency range from 5 Hz to 200MHz.

The 3577A is configured for 1M Ohm input impedance, and to measure channels B/R to obtain the closed loop gain. The same injection transformer was used.

Here is a picture of the instrument:


And the screen showing the results:


With this instrument I can measure the phase margin, it is about 23dB.

Jay_Diddy_B
« Last Edit: October 13, 2013, 02:35:07 pm by Jay_Diddy_B »
 

Offline BravoV

  • Super Contributor
  • ***
  • Posts: 7549
  • Country: 00
  • +++ ATH1
Re: Dynamic Load - Bode Plot using HP 35665A DSA
« Reply #2 on: October 13, 2013, 06:26:29 pm »
Subscribed, and I'm not pretending that I understand it, but damn sure I'm interested in this topic, its just I need time to digest it fully.

For sure, thanks for sharing this.  :-+

Offline megajocke

  • Regular Contributor
  • *
  • Posts: 191
  • Country: 00
Re: Dynamic Load - Bode Plot using HP 35665A DSA
« Reply #3 on: October 14, 2013, 07:52:09 pm »
Nice!

Looks like you did a good job there getting the parasitics that matter into the simulation. I've built something similar and also added an RC network too keep it stable. It would oscillate otherwise for some combinations of voltage and current.
 

Offline brabus

  • Frequent Contributor
  • **
  • Posts: 328
  • Country: it
Re: Dynamic Load - Bode Plot using HP 35665A DSA
« Reply #4 on: October 15, 2013, 10:43:06 am »
Thanks for sharing!

Believe me or not, I am approaching the SAME identical issue, with the electronic load I just built! :-+
I only have an oscilloscope, but I will try to build up the Bode point-by-point, measuring gain and phase as the frequency increases.

My only question:

Quote
I made my own using a 10mH common mode choke as a transformer.

Genius. :-+
How did you characterize this "particular transformer"? Is its ratio constant from 0 Hz to "xx" MHz?

Once again, thanks really a lot for your post, it's a great source of inspiration for me.
 

Offline Jay_Diddy_BTopic starter

  • Super Contributor
  • ***
  • Posts: 2764
  • Country: ca
Re: Dynamic Load - Bode Plot using HP 35665A DSA
« Reply #5 on: October 15, 2013, 02:04:07 pm »
Hi,
Thanks for sharing!

Believe me or not, I am approaching the SAME identical issue, with the electronic load I just built! :-+
I only have an oscilloscope, but I will try to build up the Bode point-by-point, measuring gain and phase as the frequency increases.

My only question:

Quote
I made my own using a 10mH common mode choke as a transformer.

Genius. :-+
How did you characterize this "particular transformer"? Is its ratio constant from 0 Hz to "xx" MHz?


Transformer selection.

This type of Common Mode choke are designed to have around 1% leakage inductance between the two windings. If I chose one with a magnetizing inductance too low, for example 1mH, it would attenuate the lower frequencies. If I chose one that was too the leakage inductance would attenuate the higher frequencies.

The transfer characteristics of the transformer are not critical, because the measurements are taken on the secondary side of the transformer.

Using a scope and a function generator.

You can make some measurements by driving the transformer with a function generator and making the measurements with a scope. You really only do this over a narrow range because one of the signals is attenuated by the loop gain of the system you are measuring.

Here are some measurements taken with a scope:

5 kHz - the gain is 20log C2/C1 = 13.5 dB


10 kHz - the gain is 8dB


25kHz - the gain is 0dB, this is the loop bandwidth. The phase margin is 85 degrees


You can see the results are very similar. The challenge is dealing with the small signals.

Jay_Diddy_B


« Last Edit: October 15, 2013, 02:05:43 pm by Jay_Diddy_B »
 

Offline brabus

  • Frequent Contributor
  • **
  • Posts: 328
  • Country: it
Re: Dynamic Load - Bode Plot using HP 35665A DSA
« Reply #6 on: October 16, 2013, 09:03:36 am »
Really thank you again Jay_Diddy_B for your answer. :-+

The best clue is lying in this sentence:

Quote
The transfer characteristics of the transformer are not critical, because the measurements are taken on the secondary side of the transformer.

I was smashing my head on the transformer linearity (like this:  |O ), but since the measurement is a ratio, the only trick is to deal with small signal amplitudes, as you said. :clap:

Also, correct me if I'm wrong: the amplitude of the sinus must be high enough to have maximum SNR, but not too high to avoid distortion.


I am looking forward to have this setup on my desk; yesterday evening I started to collect all the components, today I am buying the missing ones.

Thanks again. :-+
 

Offline Jay_Diddy_BTopic starter

  • Super Contributor
  • ***
  • Posts: 2764
  • Country: ca
Re: Dynamic Load - Bode Plot using HP 35665A DSA
« Reply #7 on: October 16, 2013, 11:26:47 am »
Hi Brabus and the group,

This is how I made my transformer selection. This model steps through 5 values of magnetizing inductance. It is assumed that the leakage inductance is 2% of the magnetizing inductance.


Here are the results:


I chose the 10mH one, red trace, because it was the best fit for my needs.

When you do this test you should monitor the output of the power supply or in this case the load current for distortion. You want to use a signal large enough to measure without distortion.


Jay_Diddy_B
 

Offline Aeternam

  • Supporter
  • ****
  • Posts: 97
  • Country: lu
    • Schartz Engineering
Re: Dynamic Load - Bode Plot using HP 35665A DSA
« Reply #8 on: June 01, 2017, 10:30:21 am »
Sorry for the thread necrology.

I'm trying to get my head around this whole oscillation thing. I understand bode plots and their interpretation. Sadly I have no access to a VNA to tinker with nor do I know exactly how they work.

I have 2 questions about OPs test setup.
- Shouldn't the test signal be injected between the inverting input and R3 instead of the point shown? For me, R3 is part of the feedback loop, so shouldn't it be "on the right side" of the injection point?
- What, precisely, is the test signal? Is it a sine wave sweep? At what amplitude?

Bonus question.
- Do you run these tests with the DUT active (in this case, V2 >0V) or with just the op-amps powered up?

Again sorry for digging up this old thread. But together with it's sibling on DC load design it has been pretty instructive and I wouldn't want to scatter all this information all over the place.
 

Offline Jay_Diddy_BTopic starter

  • Super Contributor
  • ***
  • Posts: 2764
  • Country: ca
Re: Dynamic Load - Bode Plot using HP 35665A DSA
« Reply #9 on: June 01, 2017, 12:24:18 pm »
I have 2 questions about OPs test setup.
- Shouldn't the test signal be injected between the inverting input and R3 instead of the point shown? For me, R3 is part of the feedback loop, so shouldn't it be "on the right side" of the injection point?
- What, precisely, is the test signal? Is it a sine wave sweep? At what amplitude?

Bonus question.
- Do you run these tests with the DUT active (in this case, V2 >0V) or with just the op-amps powered up?


Thank you for your interest in the thread.

There is no need to own a VNA to explore loop stability. You can explore this topic using LTspice.

In LTspice you can use either the transient analysis and the 'Network Analyzer or FRA' shown in the first post or you can you can use the AC analysis as demonstrated here:


The AC analysis can be used if the circuit does NOT contain a switching supply or similar components. The transient analysis method closely matches the measurements made with hardware in the lab.

The general idea is that the circuit being examined is powered up, as it would be normally, and the signal injector is placed in the control loop. The loop is still closed so the circuit will stay on the desired operating point.

This is how this works. The op-amp will maintain 0V between the inverting and the non-inverting inputs of the op-amp, U1. This means the voltage on node B should be equal in magnitude to the voltage on V2 but opposite in sign. In this case +0.1V. With the 0.1 ohm resistor, R1, the source current is 1A.

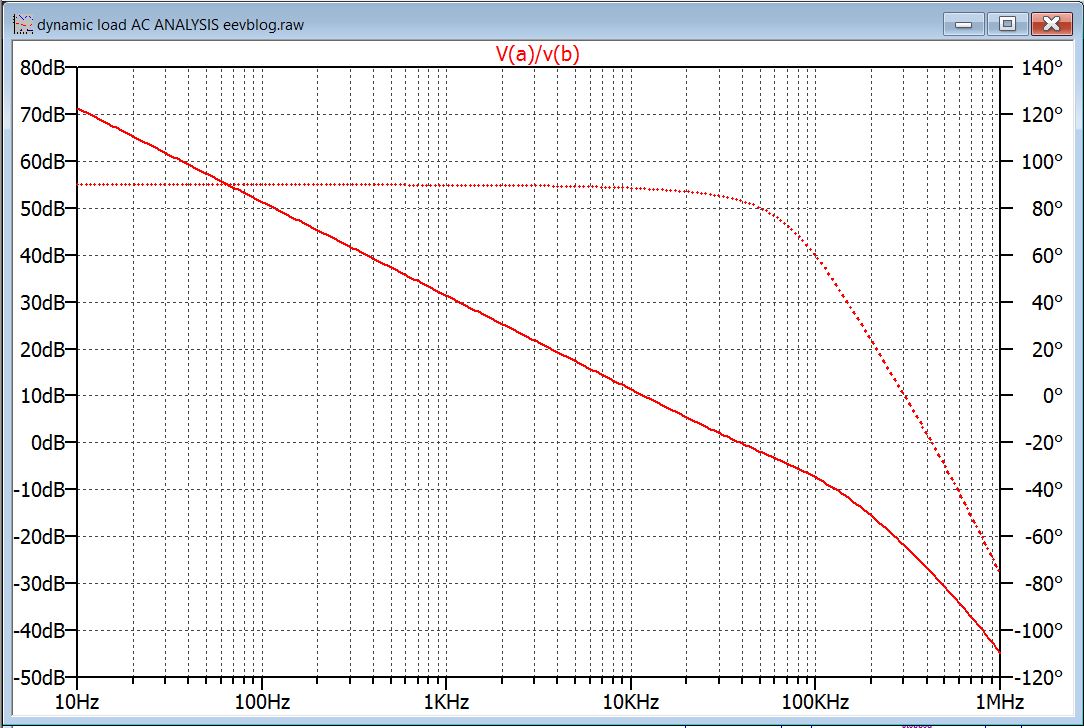
If a disturbance is applied, using V5, the op-amp will try and minimize the disturbance on node B and the disturbance signal should appear on node A. If the frequency of the disturbance is low, there is enough gain and bandwidth to achieve this. If the frequency of the disturbance is increased, the loop can not reject all the disturbance and some of the disturbance appears on node A and some on node B. The ratio of the amplitudes on nodes A and B is measurement of the circuits ability to reject the disturbance.

Since we are interested in the ratio of V(a) / V(b), the magnitude of the injection signal doesn't matter. Practically the magnitude is chosen to be a small as possible, but still allow accurate measurements to be made.
In the lab I will choose the disturbance source  to be 1 or 2% of the signal amplitude. So for a 5V power supply I would use a 50 - 100mV disturbance. The HP 3577A has fantastic ability to dig the signals out of the noise.

The injection signal is a swept sine wave or a sinewave stepped in frequency.


Here are the results from LTspice:


I have attached the LTspice model.

If you don't have LTspice, you can get it here: http://www.linear.com/designtools/software/


Regards,

Jay_Diddy_B


« Last Edit: June 01, 2017, 12:27:45 pm by Jay_Diddy_B »
 
The following users thanked this post: BravoV, Aeternam, arvidb


Share me

Digg  Facebook  SlashDot  Delicious  Technorati  Twitter  Google  Yahoo
Smf