Cs-137 that is.
In 1986 Randall Buck made air samples for a week corresponding to news reports that Chernobyl fallout was due to arrive on the USA west coast. Years later (2012) he sent me the filter paper, which I inserted into a plastic test tube and analyzed in a Bicron 2X2” end well NaI(Tl) probe, in a lead shield. Now it’s 2019 and the date from those tests are being used to show the steps in the process I use to display and analyze very small radioactive samples.
A note from Randall concerning details of his sample gathering:
“I am the one who took the air particulate sample when I was in Tehachapi CA at an elevation of 4000 ft ASL. I ran a surplus professional air sampler behind my house on an interval timer, one minute every hour , for a week if I remember correctly. I changed paper filters every day and recorded the rise and fall of the total counts per minute as recorded by a Geiger counter. The radioactive plume was predicted to arrive on the west coast of USA so I had time to set up in advance of its arrival. Geo's spectra are the first I have seen since I did not have gamma spec at that time. Randall”
A picture tour of my measurements follows, the air sample having been taking in 1986, conveyed to me for Gamma Ray Spectrometry testing in 2013, then the data from those tests reanalyzed in 2019 for this post.
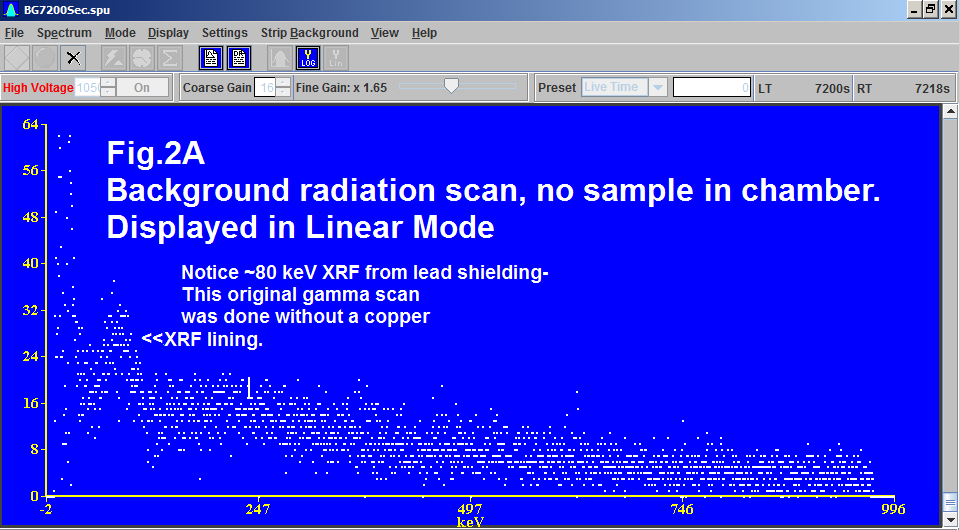
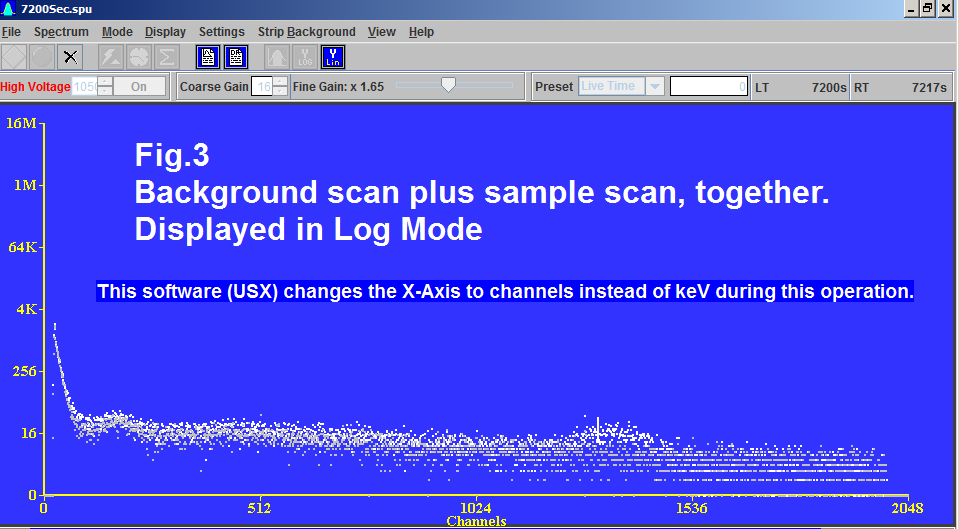
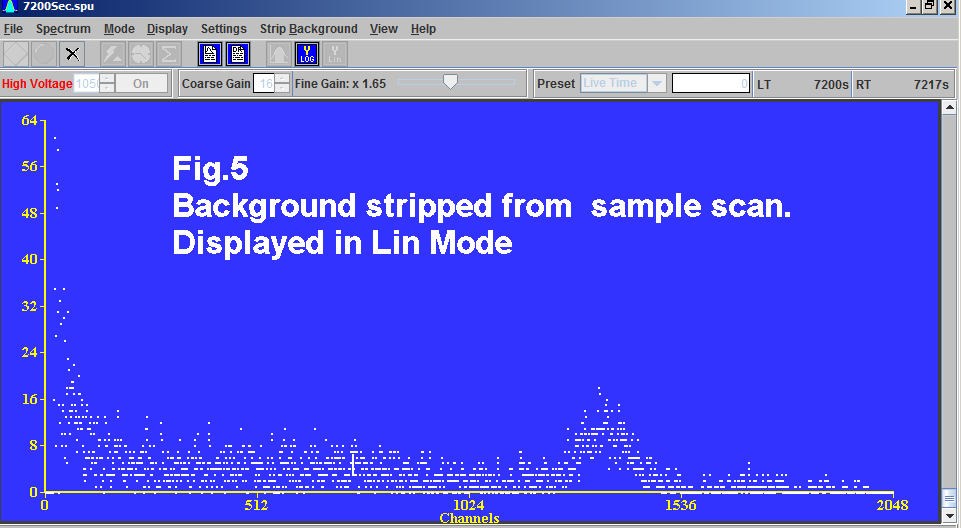
The detected Gamma Ray energy scan in keV first in logarithmic display mode, then same data in linear display mode. in most cases, to help show members the advantages of each and which to use in the final display.


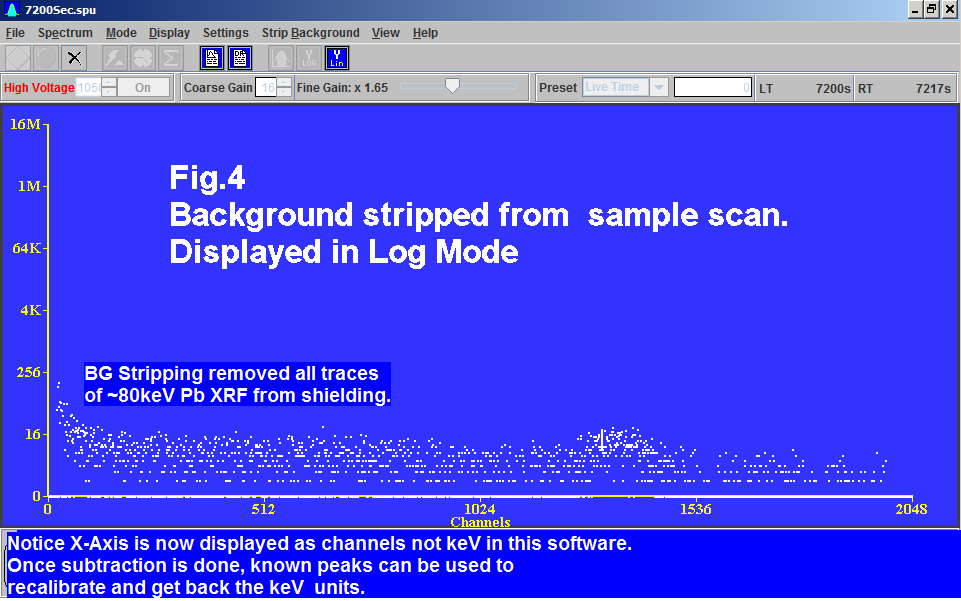


In the end, the actual amount of Cs-137 present in the sample can be calculated by repeating the setup, taking a similar scan of a known prepared sample of assayed Cs-137 in soil, and comparing the peak reports.
George Dowell


