The measurement procedures for an HP11729C operating in Phase Detector mode are documented here. The procedures described in the
HP11729C Operating and Service Manual are predicated on the use of a swept-tuned spectrum analyzer. However, the test setup on which these instructions are based employs an FFT spectrum analyzer (a PicoScope 4262), which has some significant differences to a swept-input SA. These differences create changes in the computations required to characterize phase noise in oscillators.
In regards to the use of a PicoScope in the test setup, I gratefully acknowledge the help given me by Gerry, a tech specialist active on the
PicoScope forum, navigating through several issues that affect such use.
Below is presented the steps used to compute phase noise using the test setup described in the previous message. These steps are presented in some detail so that others may evaluate them and, if desired, use them to conduct their own experiments. It should be noted that the procedure documented in this message is general and, with suitable minor modifications (e.g. elimination of step 1), should apply to any double balanced mixer with quadrature maintaining phase lock loop implementing a phase detection phase noise analyzer. To make the instructions concrete, it is assumed that the signal generator is a Rigol DG1022 and the swept-tuned spectrum analyzer is a Siglent SSA3032X. The latter is used since the Picoscope 4262 has a maximum input frequency of 5 MHz, which is insufficient to execute steps 3, 4, and 5. The oscilloscope used to monitor the two inputs to the HP11729C is a Rigol DS1104Z. The Low Frequency Low Noise Amplifier (LF-LNA) is an AlphaLab LNA 10.
Procedure to Test An Oscillator with the HP11729C in Phase Detection Mode1. Make sure the 640 MHz output and the 10 Hz-10MHz output of the HP11729C are terminated by 50Ω. Allow both the DUT and Reference Oscillator to warm up (for at least an hour).
2. Connect the coupler ports of the directional couplers to two channels of the oscilloscope with the output of the Reference Oscillator coupler port Tee'd at the oscilloscope input. Connect the Tee'd output of the Reference Oscillator oscilloscope input to a Frequency Counter (e.g. HP5335A), so that the frequency of the Reference Oscillator can be monitored. (NB: Some steps below require the use of the Frequency Counter for other purposes. When so, disconnect the Reference Oscillator at its TEE from the Frequency Counter, execute the required measurements and then reconnect the Reference Oscillator to the Frequency Counter before measuring the specturm of the HP11729C output.)
3. Connect the Reference Oscillator directional coupler through its attenuation pad to the swept-tuned spectrum analyzer. Adjust the Reference Oscillator attenuation pad so the input to the spectrum analyzer is as close to 0 dBm as possible. Note the power level for use in step 5 and then disconnect the Reference Oscillator directional coupler and attenuation pad from the spectrum analyzer.
4. Connect the DUT directional coupler through its attenuation pad to the swept-tuned spectrum analyzer. Adjust the DUT attenuation pad so the input to the spectrum analyzer is as close to but no greater than 3 dBm. Disconnect the DUT coupler and attenuation pad from the spectrum analyzer. Connect the DUT through its directional coupler and attenuation pad to the Microwave Test Signal input of the HP11729C.
5. Connect the DG1022 to the Frequency Counter. Connect a 10 MHz Disciplined Oscillator (e.g., a GPSDO) to the external 10 MHz input of the DG1022. Enable the external 10 MHz clock signal (by selecting Utility->System->Timer->External). Allow the Disciplined Oscillator and DG1022 to warm up and frequency stablize before making measurements. Set the amplitude of the DG1022 to 0 dBm. Using the Frequency Counter, adjust the Frequency setting on the DG1022 so a reading of 10.01 MHz is obtained. Disconnect the signal generator from the Frequency Counter. Measure the output level of the DG1022 by connecting it to the swept-tuned spectrum analyzer. Set the amplitude of the 10.01 MHz signal as close as possible to the value measured in step 3, minus 40 dBm. Call the difference between the value measured in step 3 and the input amplitude of the 10.01 MHz signal
Delta_SB-cal. For example, if the Reference Oscillator input to the spectrum analyzer in step 3 measured 0.61 dBm, then set the amplitude of the DG1022 signal measured by the swept-tuned spectrum analyzer as close to -39.39 dBm as possible. Disconnect the DG1022 from the swept-tuned spectrum analyzer and connect it to the 5-1280 MHz input of the HP11729C.
6. Set up the PicoScope to use Blackman-Harris windowing, dBm@50 ohm scale and select the number of bins for the FFT so the bin width is approximately 1 Hz. Choose display mode as "Average" and select an appropriate number of segments over which to compute the average (using the “Statistics Captures” box on the General tab of the Tools->Preferences window). Set the Frequency Span of the PicoScope to 20 KHz.
7. Connect the 1 Hz-1MHz output of the HP11729C to the PicoScope 4262 input. Using the PicoScope in spectrum mode, measure the power of the 10 KHz spectral line and note its value (call it
P-cal).
8. Disconnect the DG1022 from the HP11729C and connect the Reference Oscillator directional coupler through its attenuation pad to the 5-1280 MHz input of the HP11729C. Connect the 1Hz - 1 MHz output of the HP11729C to the LF-LNA In
+ input port. Make sure the In
- input port is shorted to ground. Set the gain to 1000X, 100X or 10X as appropriate. Set the input switch to In
+ - In
- and connect the output port of the LF-LNA to the PicoScope input. Connect the Freq-Cont X-Osc port of the HP11729C through a TEE to the EFC control port of the Reference Oscillator. Connect the TEE to a DVM (e.g. an HP34401A) to monitor the EFC signal.
9. Set up the PicoScope to use Blackman-Harris windowing, dBm@50 ohm scale and select an appropriate number of bins for the FFT. (Assuming the use of a PicoScope 4262, in the channel setup menu, choose 200 KHz hardware low pass filtering.) Choose display mode as "Average" and select an appropriate number of segments over which to compute the average (using the “Statistics Captures” box on the General tab of the Tools->Preferences window). Set the Frequency Span of the PicoScope to an appropriate value (but no greater than 100 KHz).
10. Set the Lock Bandwidth factor of the HP11729C to 100. On the front panel of the HP11729C, press then release Capture. If phase lock is acquired, the green LED will light on the HP11729C indicating quadrature. If phase lock is not acquired, set the Lock Bandwidth factor to 1 K and try again.
11. Start the PicoScope measurement process. After the chosen number of segments have been averaged (as indicated when the capture count equals this value), save the PicoScope spectrum in CSV format to a file and (optionally) move it to an analysis computer.
12. Using Octave, convert to mW by applying 10^(dBm_value/10). If necessary sum the bins so the spectrum is presented in 1 Hz bin increments (or as close to that as possible). That is, if necessary, sum the bins between x±.5, x=1…(upper range of spectrum) to yield bins 1 Hz wide. Ignore the bins with offset freqencies less than .5 Hz. Convert the millwatt values back to dBm.
13. To convert the measurements to phase noise, subtract
P-cal from each measured value. Then subtract the value of
Delta_SB-cal. Subtract 6 dB from each data point and subtract the equivalent dB value corresponding to the LF-LNA gain setting (i.e., 1000X -> 60 dB, 100X -> 40 dB and 10X -> 20 dB). If necessary, make a correction for any offset frequencies inside the loop bandwidth (see the Discussion section.)
14. The result of the adjustments is the phase noise value of the oscillator at the given offset frequency. For example, suppose the measurement at 10 Hz is -78 dBm,
P-cal equals -46 dBm,
Delta_SB-cal equals 40 dBm, the LF-LNA is set at 1000X gain and the Lock Bandwidth factor used to obtain phase lock was 100. Assuming no offset frequencies were inside the loop bandwidth, the phase noise value at 10 Hz would be: -78 dBm - (-46) - 40 dB - 6 dB - 60 dB = -138 dBm.
DiscussionThere are several points to make in regards to the measurement procedure.
Steps 1-6On page 21 of
HP product note 11729B-1, it states that the CW microwave input level must be between 7 and 18 dBm. However, on page 15 of
HP product note 11729C-2, it states the mixer inputs reach compression at 3 dBm. There is no guidance for the input level of signals attached to the Microwave Test signal input in the
HP11729C Operating and Service Manual. So, I needed to figure out what is the right power level for the DUT input.
I ran a test varying the input power to the Microwave Test Signal input of the HP11729C. I connected the DUT directional coupler and attenuation pad to the swept-input SA input and set the input power to 10.85 dBm. I then reattached it to the Microwave Test Signal input of the HP11729C. Figure 1 shows the resultant signal shape displayed on the oscilliscope.

Figure 1 - Microwave Test Signal at 10.85 dBm
It is obvious that some of the power of the signal at 10.85 dBm is reflecting back through the directional coupler and corrupting the coupler port signal. Specifically, harmonics of 10 MHz seem to distort the coupled signal.
I then set the input power to 2.86 dBm and connected it to the Microwave Test Signal input. The result is shown in Figure 2

Figure 2 - Microwave Test Signal at 2.86 dBm
The oscillator trace of the input signal is nice and clean, indicating that very little (if any) reflected power is getting to the coupler port.
The best explanation of the seemingly inconsistent guidance in the HP11729C literature for input power levels was provided by
John Miles in this post. There are two mixers inside the HP11729C - one in the downconverter logic and one used to phase detect the reference/DUT combined signal (see figure 4.4 on page 21 of the HP11729C-2 product note). John suggests the 7-18 dBm recommendation probably refers to the DUT input when using downconversion (and thereby using the downconverter mixer), whereas the 3 dBm compression spec refers to the phase detector mixer. Since analyzing a 10 MHz signal for phase noise does not use the downconverter logic, keeping it less than or equal to 3 dBm is probably the right thing to do.
Allowing the DG1022 sufficient time to warm up is critical. My DG1022 drifted over 81 Hz before roughly settling after 2 hours (even then, it continued to drift slowly down in frequency). This motivated the use of an external 10 MHz Disciplined Oscillator to keep the DG1022 output frequency stable.
Step 13The subtraction of
Delta_SB-cal and
P-cal from the power value corresponding to each frequency offset in the PicoScope output was a bit of mystery at first. It turns out the math deriving these corrections and the argument justifying them is trivial. However, development of the argument took some time. I thought it worthwhile to go through the logic to save others the effort in case they were interested.
Figure 3 illustrates the transformation of signal levels at the input of the HP11729C to those at the output.
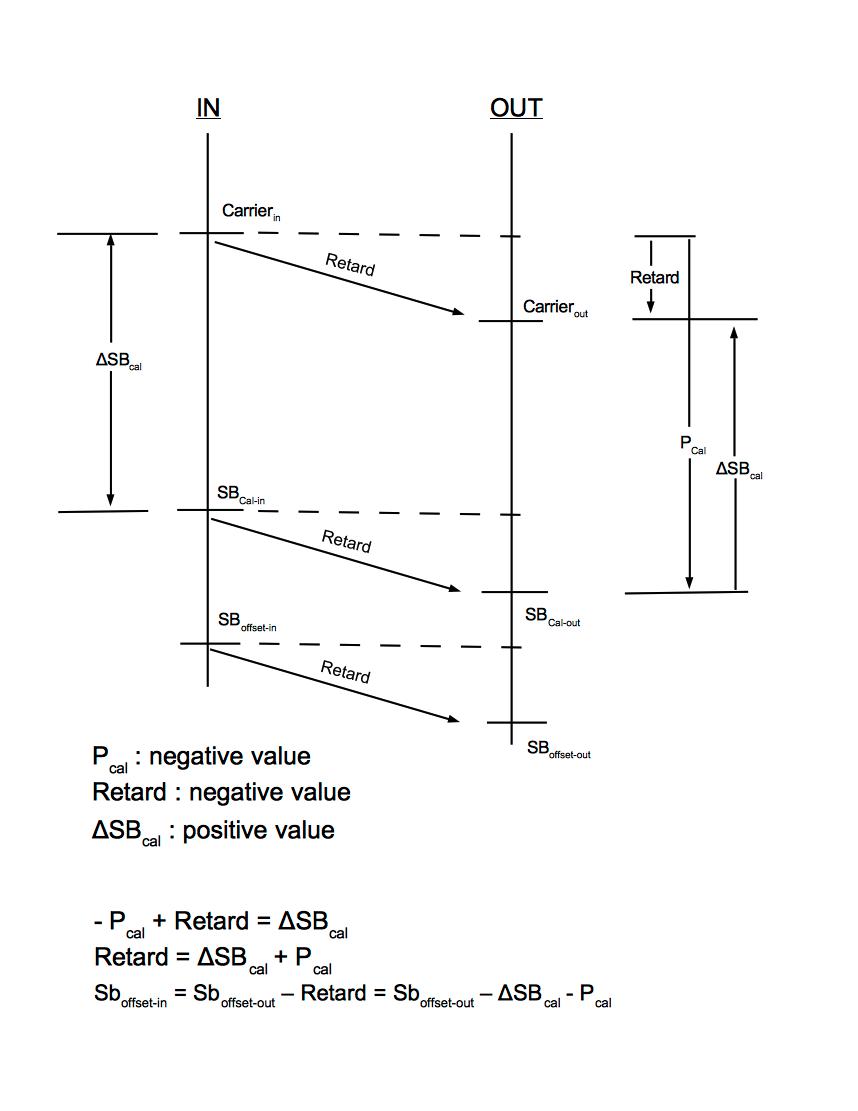
Figure 3 - The logic for the corrections using
Delta_SB-cal and
P-cal.
The HP11729C attenuates the signal levels at its inputs, which for the frequencies of interest is constant for a given setup. This attentuation value is represented as
Retard in the figure.
On the left side of the figure is shown 3 signal levels that play a role in the correction mathematics. These are the Carrier input (
Carrierin), the sideband value for the calibration signal (
SBCal-in) and the sideband value for a particular frequency offset (
SBoffset-in). Each of these signals is attenuated in amplitude at the output side of the HP11729C. While the Carrier output (
Carrierout) is shown in the figure, its value is not measureable, since the double balanced mixer in the HP11729C executes carrier suppression.
The calibration levels (
SBCal-in and
SBCal-out) are both available, but the offset level
SBoffset-in is not. Only
SBoffset-out is measured. The goal is to use
Carrierin,
SBCal-in,
SBCal-out and
SBoffset-out to compute
SBoffset-in.
The strategy is to compute
Retard and subtract it from
SBoffset-out to get
SBoffset-in.
Delta_SB-cal equals
Carrierin minus
SBCal-in and
P-cal equals
SBCal-out. As derived in the figure,
Retard equals
Delta_SB-cal plus
P-cal. Therefore,
SBoffset-in equals
SBoffset-out minus
Delta_SB-cal minus
P-cal, which is the computation carried out in step 13 .
The subtraction of 6 dB from the measured phase noise power levels is justified in Appendix A (pg. 35) of
HP product note 11729B-1. The derivation there is straight forward and so is not duplicated here.
Both the corrections section of the
HP11729C Operating and Service Manual: pg. 3-21 and
HP product note 11729B-1: pg. 25 note that for offset frequencies inside the loop bandwidth, a correction is necessary to the corresponding power levels, since they are attenuated. This is discussed on page 11 of the 11729B-1 product note in the second and third paragraphs. The attenuation is illustrated by an example shown in Figure 3.10.
The product note provides a formula for computing loop bandwidth when the HP11729C is used with an HP8662A. However, the test setup described here does not use an HP8662A; it uses a Wenzel HF-ONYX-IV, which has different characteristics than the HP8662A. So, it is necessary to derive the correct formula for loop bandwidth when using a Wenzel HF-ONYX-IV with the HP11729C.
Fortunately, Appendix B of the product note provides the necessary algebra to derive this quantity (pp. 37-38). The derivation uses 6 defined quantities:
K
d = Phase slope or phase detector gain factor of the mixer (volts/rad).
K
o = VCO (EFC) slope (Hz/volt)
F = HP11729C Lock Bandwidth Factor
K
a(s) = loop amplifier gain
N = multiplication factor when a frequency band other than 5-1280 MHz is used. For this test setup, N =1.
s = 2*PI*j*f (Hz), where f=offset frequency.
On page 38, it states that K
d * K
a * K
o = 10
-3. Whereas the values of K
d and K
a are not given, on page 3-21 of the
HP11729C Operating and Service Manual (under NOTE in the first paragraph), the value of K
o(HP8662A) is given as 10
-1 Hz/Volt. The
Wenzel HF-ONYX-IV specification indicates a tuning range over 0-10V of +/- 10
-6, which for a 10 MHz oscillator translates to a range of +/- 10 Hz. Since the HP11729C EFC tuning signal bounds are +/- 10V, this means the Wenzel slope, K
o(Wenzel), when used with an HP11729C is 20Hz/20Volts = 1Hz/V (NB: a resistor divider network changes the Wenzel EFC range from 0-10V to +/- 10V). This is 10 times the value of K
o(HP8662A). Therefore, when using the Wenzel as Reference Oscillator, K
d * K
a * K
o = 10
-2.
This means the loop bandwidth of the HP11729C/Wenzel phase detector configuration equals F/10
2]. For example, when using a Lock Bandwidth Factor of 100, the loop bandwidth equals 1 Hz.
The corrections for offsets inside the loop bandwidth are derived according to the instructions given on page 26 of the product note. However, if quadrature lock is obtained using a Lock Bandwidth Factor of 100 or less, no "inside the loop bandwidth" corrections are necessary.


