@Performa01 is correct! The relatively high noise floor is related to the SA's phase noise, not the AWG's.
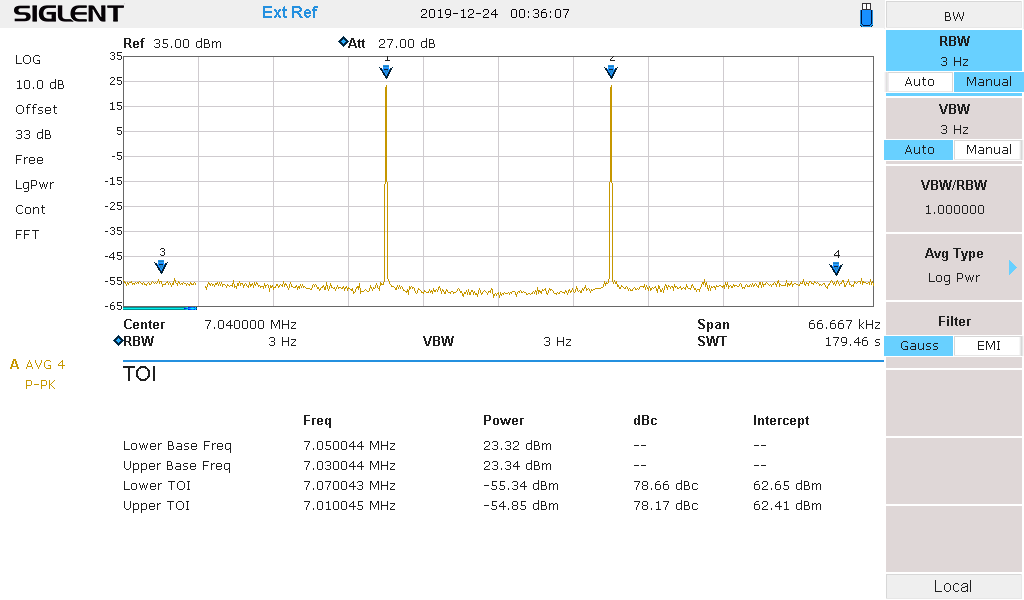
I replicated the tests with the 7.03/7.05MHz pair, as a combiner using 2*10dB attenuators on the two "female legs" of an SMA T and a 20dB attenuator form the "male leg" into the SA, providing a total attenuation (due to impedance mismatch within the T) of approx. 33dB, but very little feedback into the outputs of the generator. I added the external attenuation in the "Amplitude offset" menu of the SA so displayed levels refer to the input levels of the combiner / output of the AWG. I increased the internal attenuation of the AWG up to a point where intermodulation products disappeared in the noise floor and maybe a dB or two more. The RBW that has to eb selected in order to get a low enough noise level to display the highly attenuated signals with still a sufficiently large dynamic range, requires some serious sweep times, especially if the signal should be averaged for a better accuracy.
On both my SAs I've got the measurement functions activated and used the TOI program since it directly finds the peaks, generates the levels table and calculates the TOI point. Almost forgot to mention: For this test, I synchronized the instruments (AWG and SA) to my external reference (DIY unit, based on an Efratom LPRO101 rubidium oscillator). But I think, using the internal time bases wouldn't make much difference.
On the DSA815, the phase noise is specified to be better than -80dBc/Hz @ 10kHz (I measured about -90dBc/Hz) and better than -100dBc/Hz @ 100kHz (-110dBc/Hz measured). The phase noise vs. frequency has the typical inverse exponential shape, so nothing out of the ordinary here:

The analog test with the SSA3000X provides basically the same result, yet, due to the higher distortion in the front-end, lower input levels are necessary and thus a lower RBW has to be selected to reach a similar dynamic range of the signal. @Kladit used 1Hz, I couldn't be bothered to wait so long for the sweeps and used 3Hz

(with the Rigol DSA, I set up the test, went doing something else and came back after an odd hour or so...). The results are very similar, yet the noise floor appears more flat, almost inversely curved.
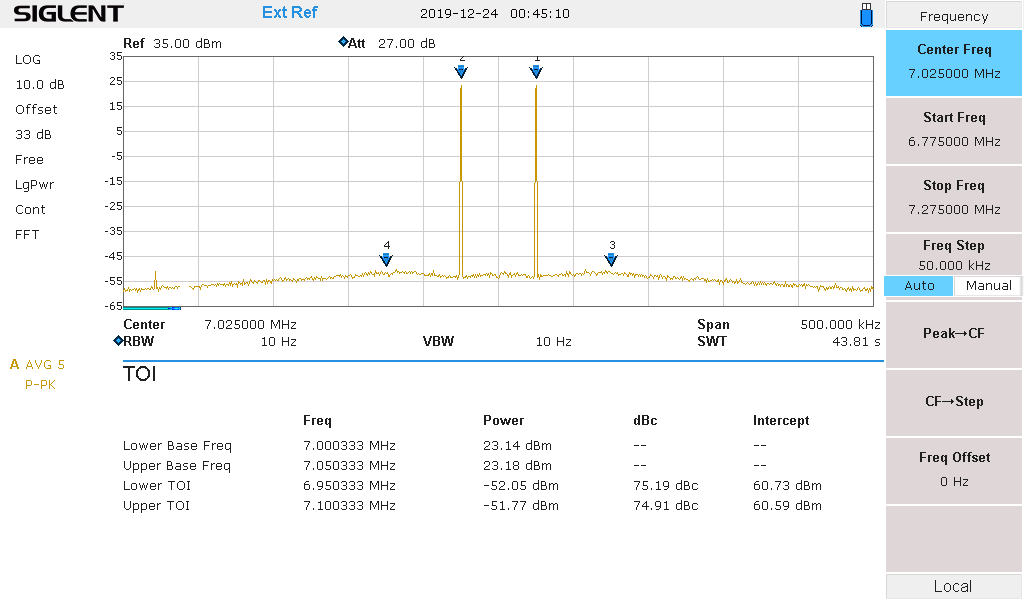
This gets even more obvious when viewing the signal over a higher span (changed RBW to 10Hz to speed things up, hence higher noise floor):

This is related to the funny shape of the phase noise of the SSA3000X with the valleys on both sides of the peak, and then rising about 10dB again about 50kHz off the peak (due to the superposition of the two tones here, the "dick and balls"
shape of that noise curve isn't as pronounced). Yet, at the selected frequencies in this example, the two tones both float within the central valley of the noise floor.
Even a small modification to the frequencies (setting them a little bit further apart -- 50kHz, 7.00MHz and 7.05MHz this time) changes the shape of the phase noise floor to a central hill between the (now) individual valleys of the two tones:
All of this is a clear indication that the phase noise is generated in the SAs and that with this kind of equipment, it's not possible to accurately measure the phase noise of the SDG6000X since it's considerably lower than that of any of the two mentioned spectrum analyzers.
Merry Christmas to all!


