First, the graph is horrendously off scale, in an intentionally misleading way. He draws a vertical line in the middle, like this:
|--|--|
To represent where a battery would drop below nominal voltage and become useless. Had the graph been to scale, it would have been about here:
|------------------------------------|--|
Better yet, here's a REAL discharge curve under various constant current loads:
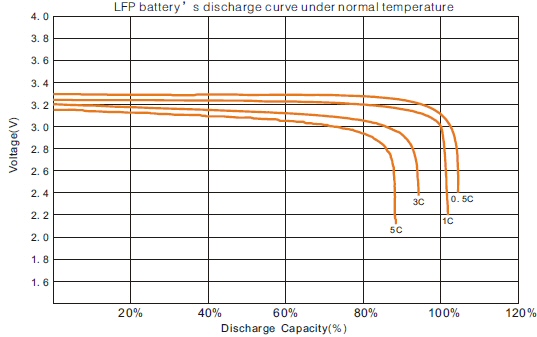
There is very little usable energy left in the battery once voltage starts to drop below nominal, which it does rapidly.
I have not looked at the Batterizer, but presumably, it uses a voltage boost circuit to provide nominal voltage (V) anyway. But if your device needs 100mA at V, and the battery is at 1/2 V, that means the Batterizer is going to be draining 200mA from the battery! And the battery voltage is going to drop off even faster than in the graph above.
So that's the second error in the YT graph, claiming the current drain on the battery will remain constant, even when the battery voltage drops below nominal.


